|
ACloudViewer
3.9.4
A Modern Library for 3D Data Processing
|
|
ACloudViewer
3.9.4
A Modern Library for 3D Data Processing
|
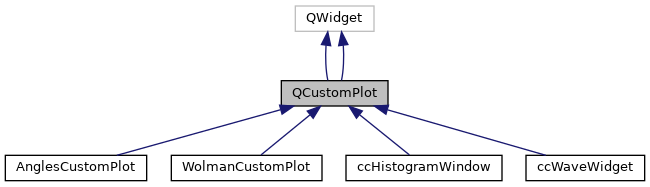
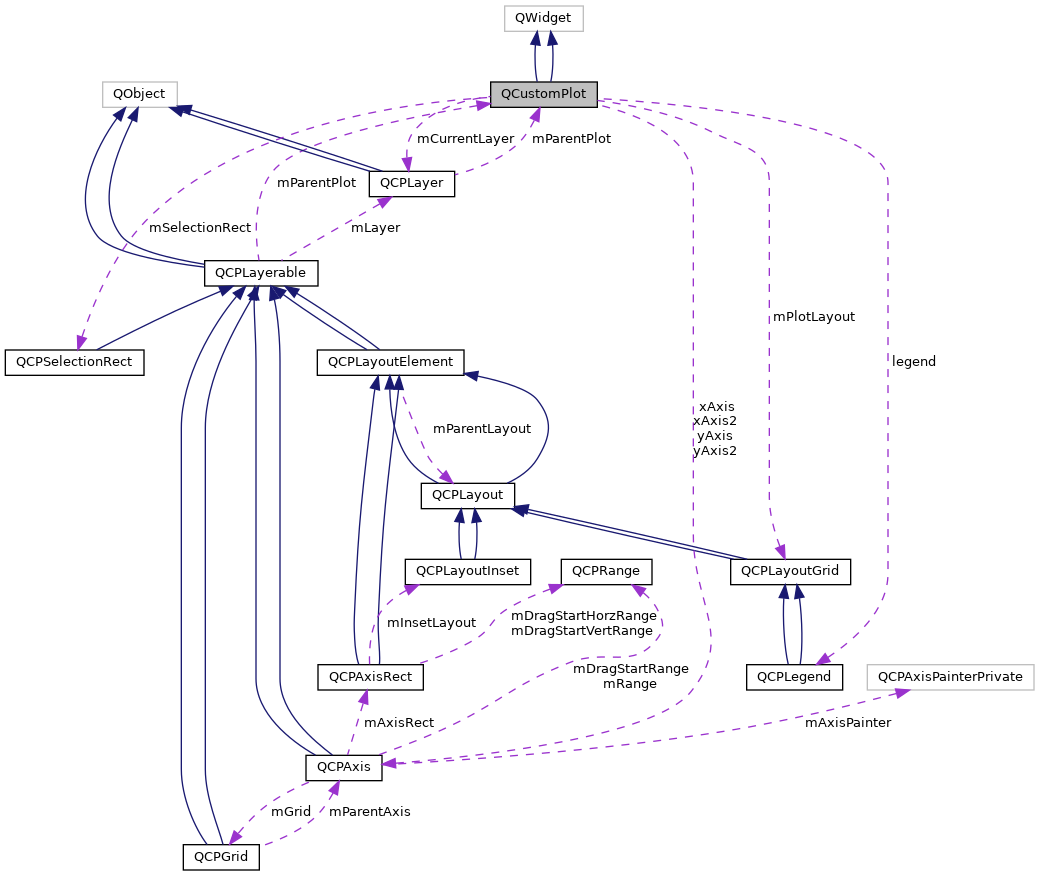
The central class of the library. This is the QWidget which displays the plot and interacts with the user. More...
#include <qcustomplot.h>
Public Types | |
| enum | LayerInsertMode { limBelow , limAbove , limBelow , limAbove } |
| enum | RefreshPriority { rpImmediateRefresh , rpQueuedRefresh , rpRefreshHint , rpQueuedReplot , rpImmediate , rpQueued , rpHint } |
| enum | LayerInsertMode { limBelow , limAbove , limBelow , limAbove } |
| enum | RefreshPriority { rpImmediateRefresh , rpQueuedRefresh , rpRefreshHint , rpQueuedReplot , rpImmediate , rpQueued , rpHint } |
Public Member Functions | |
| QCustomPlot (QWidget *parent=0) | |
| virtual | ~QCustomPlot () |
| QRect | viewport () const |
| double | bufferDevicePixelRatio () const |
| QPixmap | background () const |
| bool | backgroundScaled () const |
| Qt::AspectRatioMode | backgroundScaledMode () const |
| QCPLayoutGrid * | plotLayout () const |
| QCP::AntialiasedElements | antialiasedElements () const |
| QCP::AntialiasedElements | notAntialiasedElements () const |
| bool | autoAddPlottableToLegend () const |
| const QCP::Interactions | interactions () const |
| int | selectionTolerance () const |
| bool | noAntialiasingOnDrag () const |
| QCP::PlottingHints | plottingHints () const |
| Qt::KeyboardModifier | multiSelectModifier () const |
| QCP::SelectionRectMode | selectionRectMode () const |
| QCPSelectionRect * | selectionRect () const |
| bool | openGl () const |
| void | setViewport (const QRect &rect) |
| void | setBufferDevicePixelRatio (double ratio) |
| void | setBackground (const QPixmap &pm) |
| void | setBackground (const QPixmap &pm, bool scaled, Qt::AspectRatioMode mode=Qt::KeepAspectRatioByExpanding) |
| void | setBackground (const QBrush &brush) |
| void | setBackgroundScaled (bool scaled) |
| void | setBackgroundScaledMode (Qt::AspectRatioMode mode) |
| void | setAntialiasedElements (const QCP::AntialiasedElements &antialiasedElements) |
| void | setAntialiasedElement (QCP::AntialiasedElement antialiasedElement, bool enabled=true) |
| void | setNotAntialiasedElements (const QCP::AntialiasedElements ¬AntialiasedElements) |
| void | setNotAntialiasedElement (QCP::AntialiasedElement notAntialiasedElement, bool enabled=true) |
| void | setAutoAddPlottableToLegend (bool on) |
| void | setInteractions (const QCP::Interactions &interactions) |
| void | setInteraction (const QCP::Interaction &interaction, bool enabled=true) |
| void | setSelectionTolerance (int pixels) |
| void | setNoAntialiasingOnDrag (bool enabled) |
| void | setPlottingHints (const QCP::PlottingHints &hints) |
| void | setPlottingHint (QCP::PlottingHint hint, bool enabled=true) |
| void | setMultiSelectModifier (Qt::KeyboardModifier modifier) |
| void | setSelectionRectMode (QCP::SelectionRectMode mode) |
| void | setSelectionRect (QCPSelectionRect *selectionRect) |
| void | setOpenGl (bool enabled, int multisampling=16) |
| QCPAbstractPlottable * | plottable (int index) |
| QCPAbstractPlottable * | plottable () |
| bool | removePlottable (QCPAbstractPlottable *plottable) |
| bool | removePlottable (int index) |
| int | clearPlottables () |
| int | plottableCount () const |
| QList< QCPAbstractPlottable * > | selectedPlottables () const |
| QCPAbstractPlottable * | plottableAt (const QPointF &pos, bool onlySelectable=false) const |
| bool | hasPlottable (QCPAbstractPlottable *plottable) const |
| QCPGraph * | graph (int index) const |
| QCPGraph * | graph () const |
| QCPGraph * | addGraph (QCPAxis *keyAxis=0, QCPAxis *valueAxis=0) |
| bool | removeGraph (QCPGraph *graph) |
| bool | removeGraph (int index) |
| int | clearGraphs () |
| int | graphCount () const |
| QList< QCPGraph * > | selectedGraphs () const |
| QCPAbstractItem * | item (int index) const |
| QCPAbstractItem * | item () const |
| bool | removeItem (QCPAbstractItem *item) |
| bool | removeItem (int index) |
| int | clearItems () |
| int | itemCount () const |
| QList< QCPAbstractItem * > | selectedItems () const |
| QCPAbstractItem * | itemAt (const QPointF &pos, bool onlySelectable=false) const |
| bool | hasItem (QCPAbstractItem *item) const |
| QCPLayer * | layer (const QString &name) const |
| QCPLayer * | layer (int index) const |
| QCPLayer * | currentLayer () const |
| bool | setCurrentLayer (const QString &name) |
| bool | setCurrentLayer (QCPLayer *layer) |
| int | layerCount () const |
| bool | addLayer (const QString &name, QCPLayer *otherLayer=0, LayerInsertMode insertMode=limAbove) |
| bool | removeLayer (QCPLayer *layer) |
| bool | moveLayer (QCPLayer *layer, QCPLayer *otherLayer, LayerInsertMode insertMode=limAbove) |
| int | axisRectCount () const |
| QCPAxisRect * | axisRect (int index=0) const |
| QList< QCPAxisRect * > | axisRects () const |
| QCPLayoutElement * | layoutElementAt (const QPointF &pos) const |
| QCPAxisRect * | axisRectAt (const QPointF &pos) const |
| Q_SLOT void | rescaleAxes (bool onlyVisiblePlottables=false) |
| QList< QCPAxis * > | selectedAxes () const |
| QList< QCPLegend * > | selectedLegends () const |
| Q_SLOT void | deselectAll () |
| bool | savePdf (const QString &fileName, int width=0, int height=0, QCP::ExportPen exportPen=QCP::epAllowCosmetic, const QString &pdfCreator=QString(), const QString &pdfTitle=QString()) |
| bool | savePng (const QString &fileName, int width=0, int height=0, double scale=1.0, int quality=-1, int resolution=96, QCP::ResolutionUnit resolutionUnit=QCP::ruDotsPerInch) |
| bool | saveJpg (const QString &fileName, int width=0, int height=0, double scale=1.0, int quality=-1, int resolution=96, QCP::ResolutionUnit resolutionUnit=QCP::ruDotsPerInch) |
| bool | saveBmp (const QString &fileName, int width=0, int height=0, double scale=1.0, int resolution=96, QCP::ResolutionUnit resolutionUnit=QCP::ruDotsPerInch) |
| bool | saveRastered (const QString &fileName, int width, int height, double scale, const char *format, int quality=-1, int resolution=96, QCP::ResolutionUnit resolutionUnit=QCP::ruDotsPerInch) |
| QPixmap | toPixmap (int width=0, int height=0, double scale=1.0) |
| void | toPainter (QCPPainter *painter, int width=0, int height=0) |
| Q_SLOT void | replot (QCustomPlot::RefreshPriority refreshPriority=QCustomPlot::rpRefreshHint) |
| QCustomPlot (QWidget *parent=0) | |
| virtual | ~QCustomPlot () |
| QRect | viewport () const |
| QPixmap | background () const |
| bool | backgroundScaled () const |
| Qt::AspectRatioMode | backgroundScaledMode () const |
| QCPLayoutGrid * | plotLayout () const |
| QCP::AntialiasedElements | antialiasedElements () const |
| QCP::AntialiasedElements | notAntialiasedElements () const |
| bool | autoAddPlottableToLegend () const |
| const QCP::Interactions | interactions () const |
| int | selectionTolerance () const |
| bool | noAntialiasingOnDrag () const |
| QCP::PlottingHints | plottingHints () const |
| Qt::KeyboardModifier | multiSelectModifier () const |
| void | setViewport (const QRect &rect) |
| void | setBackground (const QPixmap &pm) |
| void | setBackground (const QPixmap &pm, bool scaled, Qt::AspectRatioMode mode=Qt::KeepAspectRatioByExpanding) |
| void | setBackground (const QBrush &brush) |
| void | setBackgroundScaled (bool scaled) |
| void | setBackgroundScaledMode (Qt::AspectRatioMode mode) |
| void | setAntialiasedElements (const QCP::AntialiasedElements &antialiasedElements) |
| void | setAntialiasedElement (QCP::AntialiasedElement antialiasedElement, bool enabled=true) |
| void | setNotAntialiasedElements (const QCP::AntialiasedElements ¬AntialiasedElements) |
| void | setNotAntialiasedElement (QCP::AntialiasedElement notAntialiasedElement, bool enabled=true) |
| void | setAutoAddPlottableToLegend (bool on) |
| void | setInteractions (const QCP::Interactions &interactions) |
| void | setInteraction (const QCP::Interaction &interaction, bool enabled=true) |
| void | setSelectionTolerance (int pixels) |
| void | setNoAntialiasingOnDrag (bool enabled) |
| void | setPlottingHints (const QCP::PlottingHints &hints) |
| void | setPlottingHint (QCP::PlottingHint hint, bool enabled=true) |
| void | setMultiSelectModifier (Qt::KeyboardModifier modifier) |
| QCPAbstractPlottable * | plottable (int index) |
| QCPAbstractPlottable * | plottable () |
| bool | addPlottable (QCPAbstractPlottable *plottable) |
| bool | removePlottable (QCPAbstractPlottable *plottable) |
| bool | removePlottable (int index) |
| int | clearPlottables () |
| int | plottableCount () const |
| QList< QCPAbstractPlottable * > | selectedPlottables () const |
| QCPAbstractPlottable * | plottableAt (const QPointF &pos, bool onlySelectable=false) const |
| bool | hasPlottable (QCPAbstractPlottable *plottable) const |
| QCPGraph * | graph (int index) const |
| QCPGraph * | graph () const |
| QCPGraph * | addGraph (QCPAxis *keyAxis=0, QCPAxis *valueAxis=0) |
| bool | removeGraph (QCPGraph *graph) |
| bool | removeGraph (int index) |
| int | clearGraphs () |
| int | graphCount () const |
| QList< QCPGraph * > | selectedGraphs () const |
| QCPAbstractItem * | item (int index) const |
| QCPAbstractItem * | item () const |
| bool | addItem (QCPAbstractItem *item) |
| bool | removeItem (QCPAbstractItem *item) |
| bool | removeItem (int index) |
| int | clearItems () |
| int | itemCount () const |
| QList< QCPAbstractItem * > | selectedItems () const |
| QCPAbstractItem * | itemAt (const QPointF &pos, bool onlySelectable=false) const |
| bool | hasItem (QCPAbstractItem *item) const |
| QCPLayer * | layer (const QString &name) const |
| QCPLayer * | layer (int index) const |
| QCPLayer * | currentLayer () const |
| bool | setCurrentLayer (const QString &name) |
| bool | setCurrentLayer (QCPLayer *layer) |
| int | layerCount () const |
| bool | addLayer (const QString &name, QCPLayer *otherLayer=0, LayerInsertMode insertMode=limAbove) |
| bool | removeLayer (QCPLayer *layer) |
| bool | moveLayer (QCPLayer *layer, QCPLayer *otherLayer, LayerInsertMode insertMode=limAbove) |
| int | axisRectCount () const |
| QCPAxisRect * | axisRect (int index=0) const |
| QList< QCPAxisRect * > | axisRects () const |
| QCPLayoutElement * | layoutElementAt (const QPointF &pos) const |
| Q_SLOT void | rescaleAxes (bool onlyVisiblePlottables=false) |
| QList< QCPAxis * > | selectedAxes () const |
| QList< QCPLegend * > | selectedLegends () const |
| Q_SLOT void | deselectAll () |
| bool | savePdf (const QString &fileName, bool noCosmeticPen=false, int width=0, int height=0, const QString &pdfCreator=QString(), const QString &pdfTitle=QString()) |
| bool | savePng (const QString &fileName, int width=0, int height=0, double scale=1.0, int quality=-1) |
| bool | saveJpg (const QString &fileName, int width=0, int height=0, double scale=1.0, int quality=-1) |
| bool | saveBmp (const QString &fileName, int width=0, int height=0, double scale=1.0) |
| bool | saveRastered (const QString &fileName, int width, int height, double scale, const char *format, int quality=-1) |
| QPixmap | toPixmap (int width=0, int height=0, double scale=1.0) |
| void | toPainter (QCPPainter *painter, int width=0, int height=0) |
| Q_SLOT void | replot (QCustomPlot::RefreshPriority refreshPriority=QCustomPlot::rpHint) |
Public Attributes | |
| QCPAxis * | xAxis |
| QCPAxis * | yAxis |
| QCPAxis * | xAxis2 |
| QCPAxis * | yAxis2 |
| QCPLegend * | legend |
Protected Member Functions | |
| virtual QSize | minimumSizeHint () const |
| virtual QSize | sizeHint () const |
| virtual void | paintEvent (QPaintEvent *event) |
| virtual void | resizeEvent (QResizeEvent *event) |
| virtual void | mouseDoubleClickEvent (QMouseEvent *event) |
| virtual void | mousePressEvent (QMouseEvent *event) |
| virtual void | mouseMoveEvent (QMouseEvent *event) |
| virtual void | mouseReleaseEvent (QMouseEvent *event) |
| virtual void | wheelEvent (QWheelEvent *event) |
| virtual void | draw (QCPPainter *painter) |
| virtual void | updateLayout () |
| virtual void | axisRemoved (QCPAxis *axis) |
| virtual void | legendRemoved (QCPLegend *legend) |
| virtual Q_SLOT void | processRectSelection (QRect rect, QMouseEvent *event) |
| virtual Q_SLOT void | processRectZoom (QRect rect, QMouseEvent *event) |
| virtual Q_SLOT void | processPointSelection (QMouseEvent *event) |
| bool | registerPlottable (QCPAbstractPlottable *plottable) |
| bool | registerGraph (QCPGraph *graph) |
| bool | registerItem (QCPAbstractItem *item) |
| void | updateLayerIndices () const |
| QCPLayerable * | layerableAt (const QPointF &pos, bool onlySelectable, QVariant *selectionDetails=0) const |
| QList< QCPLayerable * > | layerableListAt (const QPointF &pos, bool onlySelectable, QList< QVariant > *selectionDetails=0) const |
| void | drawBackground (QCPPainter *painter) |
| void | setupPaintBuffers () |
| QCPAbstractPaintBuffer * | createPaintBuffer () |
| bool | hasInvalidatedPaintBuffers () |
| bool | setupOpenGl () |
| void | freeOpenGl () |
| virtual QSize | minimumSizeHint () const |
| virtual QSize | sizeHint () const |
| virtual void | paintEvent (QPaintEvent *event) |
| virtual void | resizeEvent (QResizeEvent *event) |
| virtual void | mouseDoubleClickEvent (QMouseEvent *event) |
| virtual void | mousePressEvent (QMouseEvent *event) |
| virtual void | mouseMoveEvent (QMouseEvent *event) |
| virtual void | mouseReleaseEvent (QMouseEvent *event) |
| virtual void | wheelEvent (QWheelEvent *event) |
| virtual void | draw (QCPPainter *painter) |
| virtual void | axisRemoved (QCPAxis *axis) |
| virtual void | legendRemoved (QCPLegend *legend) |
| void | updateLayerIndices () const |
| QCPLayerable * | layerableAt (const QPointF &pos, bool onlySelectable, QVariant *selectionDetails=0) const |
| void | drawBackground (QCPPainter *painter) |
The central class of the library. This is the QWidget which displays the plot and interacts with the user.
For tutorials on how to use QCustomPlot, see the website
http://www.qcustomplot.com/
Definition at line 4167 of file qcustomplot.h.
Defines how a layer should be inserted relative to an other layer.
| Enumerator | |
|---|---|
| limBelow | Layer is inserted below other layer. |
| limAbove | Layer is inserted above other layer. |
| limBelow | Layer is inserted below other layer. |
| limAbove | Layer is inserted above other layer. |
Definition at line 4193 of file qcustomplot.h.
Defines how a layer should be inserted relative to an other layer.
| Enumerator | |
|---|---|
| limBelow | Layer is inserted below other layer. |
| limAbove | Layer is inserted above other layer. |
| limBelow | Layer is inserted below other layer. |
| limAbove | Layer is inserted above other layer. |
Definition at line 2045 of file qcustomplot.h.
Defines with what timing the QCustomPlot surface is refreshed after a replot.
| Enumerator | |
|---|---|
| rpImmediateRefresh | Replots immediately and repaints the widget immediately by calling QWidget::repaint() after the replot |
| rpQueuedRefresh | Replots immediately, but queues the widget repaint, by calling QWidget::update() after the replot. This way multiple redundant widget repaints can be avoided. |
| rpRefreshHint | Whether to use immediate or queued refresh depends on whether the plotting hint QCP::phImmediateRefresh is set, see setPlottingHints. |
| rpQueuedReplot | Queues the entire replot for the next event loop iteration. This way multiple redundant replots can be avoided. The actual replot is then done with rpRefreshHint priority. |
| rpImmediate | The QCustomPlot surface is immediately refreshed, by calling QWidget::repaint() after the replot |
| rpQueued | Queues the refresh such that it is performed at a slightly delayed point in time after the replot, by calling QWidget::update() after the replot |
| rpHint | Whether to use immediate repaint or queued update depends on whether the plotting hint QCP::phForceRepaint is set, see setPlottingHints. |
Definition at line 4206 of file qcustomplot.h.
Defines with what timing the QCustomPlot surface is refreshed after a replot.
| Enumerator | |
|---|---|
| rpImmediateRefresh | Replots immediately and repaints the widget immediately by calling QWidget::repaint() after the replot |
| rpQueuedRefresh | Replots immediately, but queues the widget repaint, by calling QWidget::update() after the replot. This way multiple redundant widget repaints can be avoided. |
| rpRefreshHint | Whether to use immediate or queued refresh depends on whether the plotting hint QCP::phImmediateRefresh is set, see setPlottingHints. |
| rpQueuedReplot | Queues the entire replot for the next event loop iteration. This way multiple redundant replots can be avoided. The actual replot is then done with rpRefreshHint priority. |
| rpImmediate | The QCustomPlot surface is immediately refreshed, by calling QWidget::repaint() after the replot |
| rpQueued | Queues the refresh such that it is performed at a slightly delayed point in time after the replot, by calling QWidget::update() after the replot |
| rpHint | Whether to use immediate repaint or queued update depends on whether the plotting hint QCP::phForceRepaint is set, see setPlottingHints. |
Definition at line 2058 of file qcustomplot.h.
|
explicit |
Constructs a QCustomPlot and sets reasonable default values.
Definition at line 13334 of file qcustomplot.cpp.
References QCPLayoutGrid::addElement(), QCPLayoutInset::addElement(), QCPAxis::atBottom, QCPAxis::atLeft, QCPAxis::atRight, QCPAxis::atTop, QCPAxisRect::axis(), QCPAxis::grid(), QCPLayerable::initializeParentPlot(), QCPAxisRect::insetLayout(), layer(), legend, QCPLayer::lmBuffered, mAntialiasedElements, mLayers, mOpenGlAntialiasedElementsBackup, mOpenGlCacheLabelsBackup, mPlotLayout, mPlottingHints, mSelectionRect, QCP::phCacheLabels, QCPAxisRect, QCPLayer, QCPLegend, replot(), rpQueuedReplot, setBufferDevicePixelRatio(), setCurrentLayer(), QCPLayerable::setLayer(), QCPLayoutElement::setMargins(), QCPLayer::setMode(), setViewport(), QCPLayerable::setVisible(), updateLayerIndices(), xAxis, xAxis2, yAxis, and yAxis2.
|
virtual |
Definition at line 13434 of file qcustomplot.cpp.
References clearItems(), clearPlottables(), mCurrentLayer, mLayers, and mPlotLayout.
|
explicit |
|
virtual |
Creates a new graph inside the plot. If keyAxis and valueAxis are left unspecified (0), the bottom (xAxis) is used as key and the left (yAxis) is used as value axis. If specified, keyAxis and valueAxis must reside in this QCustomPlot.
keyAxis will be used as key axis (typically "x") and valueAxis as value axis (typically "y") for the graph.
Returns a pointer to the newly created graph, or 0 if adding the graph failed.
Definition at line 14222 of file qcustomplot.cpp.
References mGraphs, QCPLayerable::parentPlot(), QCPGraph, QCPAbstractPlottable::setName(), xAxis, and yAxis.
Referenced by cvProbeFilter::apply(), ccHistogramWindow::refresh(), ccWaveWidget::refresh(), and WolmanCustomPlot::WolmanCustomPlot().
| bool QCustomPlot::addItem | ( | QCPAbstractItem * | item | ) |
Adds the specified item to the plot. QCustomPlot takes ownership of the item.
Returns true on success, i.e. when item wasn't already in the plot and the parent plot of item is this QCustomPlot.
Definition at line 10136 of file qcustomplot.cpp.
References item(), mItems, and QCPLayerable::parentPlot().
| bool QCustomPlot::addLayer | ( | const QString & | name, |
| QCPLayer * | otherLayer = 0, |
||
| QCustomPlot::LayerInsertMode | insertMode = limAbove |
||
| ) |
Adds a new layer to this QCustomPlot instance. The new layer will have the name name, which must be unique. Depending on insertMode, it is positioned either below or above otherLayer.
Returns true on success, i.e. if there is no other layer named name and otherLayer is a valid layer inside this QCustomPlot.
If otherLayer is 0, the highest layer in the QCustomPlot will be used.
For an explanation of what layers are in QCustomPlot, see the documentation of QCPLayer.
Definition at line 14559 of file qcustomplot.cpp.
References QCPLayer::index(), layer(), limAbove, mLayers, name, QCPLayer, setupPaintBuffers(), and updateLayerIndices().
| bool QCustomPlot::addLayer | ( | const QString & | name, |
| QCPLayer * | otherLayer = 0, |
||
| LayerInsertMode | insertMode = limAbove |
||
| ) |
| bool QCustomPlot::addPlottable | ( | QCPAbstractPlottable * | plottable | ) |
Adds the specified plottable to the plot and, if setAutoAddPlottableToLegend is enabled, to the legend (QCustomPlot::legend). QCustomPlot takes ownership of the plottable.
Returns true on success, i.e. when plottable isn't already in the plot and the parent plot of plottable is this QCustomPlot (the latter is controlled by what axes were passed in the plottable's constructor).
Definition at line 9803 of file qcustomplot.cpp.
References QCPAbstractPlottable::addToLegend(), currentLayer(), graph(), QCPLayerable::layer(), mAutoAddPlottableToLegend, mGraphs, mPlottables, QCPLayerable::parentPlot(), plottable(), and QCPLayerable::setLayer().
|
signal |
This signal is emitted immediately after a replot has taken place (caused by a call to the slot replot).
It is safe to mutually connect the replot slot with this signal on two QCustomPlots to make them replot synchronously, it won't cause an infinite recursion.
Referenced by replot().
|
signal |
|
inline |
Definition at line 4240 of file qcustomplot.h.
Referenced by QCPLayerable::applyAntialiasingHint(), QCPAxis::mousePressEvent(), QCPAxisRect::mousePressEvent(), and setAntialiasedElements().
|
inline |
Definition at line 2082 of file qcustomplot.h.
|
inline |
Definition at line 4246 of file qcustomplot.h.
|
inline |
Definition at line 2088 of file qcustomplot.h.
|
signal |
This signal is emitted when an axis is clicked.
event is the mouse event that caused the click, axis is the axis that received the click and part indicates the part of the axis that was clicked.
Referenced by mouseReleaseEvent().
|
signal |
|
signal |
Referenced by mouseDoubleClickEvent().
|
signal |
| QCPAxisRect * QCustomPlot::axisRect | ( | int | index = 0 | ) | const |
Returns the axis rect with index.
Initially, only one axis rect (with index 0) exists in the plot. If multiple axis rects were added, all of them may be accessed with this function in a linear fashion (even when they are nested in a layout hierarchy or inside other axis rects via QCPAxisRect::insetLayout).
The order of the axis rects is given by the fill order of the QCPLayout that is holding them. For example, if the axis rects are in the top level grid layout (accessible via QCustomPlot::plotLayout), they are ordered from left to right, top to bottom, if the layout's default setFillOrder of foColumnsFirst wasn't changed.
If you want to access axis rects by their row and column index, use the layout interface. For example, use QCPLayoutGrid::element of the top level grid layout, and qobject_cast the returned layout element to QCPAxisRect. (See also thelayoutsystem.)
Returns the axis rect with index.
Initially, only one axis rect (with index 0) exists in the plot. If multiple axis rects were added, all of them may be accessed with this function in a linear fashion (even when they are nested in a layout hierarchy or inside other axis rects via QCPAxisRect::insetLayout).
Definition at line 14712 of file qcustomplot.cpp.
References axisRects().
Referenced by QCPAxisRect::addAxis(), QCPAbstractItem::createPosition(), QCPAxisRect::layoutChanged(), and processRectZoom().
| QCPAxisRect* QCustomPlot::axisRect | ( | int | index = 0 | ) | const |
| QCPAxisRect * QCustomPlot::axisRectAt | ( | const QPointF & | pos | ) | const |
Returns the layout element of type QCPAxisRect at pixel position pos. This method ignores other layout elements even if they are visually in front of the axis rect (e.g. a QCPLegend). If there is no axis rect at that position, returns 0.
Only visible axis rects are used. If QCPLayoutElement::setVisible on the axis rect itself or on any of its parent elements is set to false, it will not be considered.
Definition at line 14793 of file qcustomplot.cpp.
References QCPLayoutElement::elements(), mPlotLayout, QCPLayerable::realVisibility(), result, and QCPLayoutElement::selectTest().
Referenced by mousePressEvent(), processRectSelection(), and processRectZoom().
| int QCustomPlot::axisRectCount | ( | ) | const |
Returns the number of axis rects in the plot.
All axis rects can be accessed via QCustomPlot::axisRect().
Initially, only one axis rect exists in the plot.
Definition at line 14688 of file qcustomplot.cpp.
References axisRects().
Referenced by QCPAxisRect::addAxis(), and QCPAxisRect::layoutChanged().
| int QCustomPlot::axisRectCount | ( | ) | const |
| QList< QCPAxisRect * > QCustomPlot::axisRects | ( | ) | const |
Returns all axis rects in the plot.
The order of the axis rects is given by the fill order of the QCPLayout that is holding them. For example, if the axis rects are in the top level grid layout (accessible via QCustomPlot::plotLayout), they are ordered from left to right, top to bottom, if the layout's default setFillOrder of foColumnsFirst wasn't changed.
Returns all axis rects in the plot.
Definition at line 14734 of file qcustomplot.cpp.
References QCPLayoutElement::elements(), mPlotLayout, and result.
Referenced by axisRect(), axisRectCount(), QCPAbstractItem::QCPAbstractItem(), rescaleAxes(), and selectedAxes().
| QList<QCPAxisRect *> QCustomPlot::axisRects | ( | ) | const |
|
protectedvirtual |
Definition at line 15854 of file qcustomplot.cpp.
References xAxis, xAxis2, yAxis, and yAxis2.
Referenced by QCPAxisRect::removeAxis().
|
protectedvirtual |
|
inline |
Definition at line 4234 of file qcustomplot.h.
|
inline |
Definition at line 2076 of file qcustomplot.h.
|
inline |
Definition at line 4235 of file qcustomplot.h.
|
inline |
Definition at line 2077 of file qcustomplot.h.
|
inline |
Definition at line 4236 of file qcustomplot.h.
|
inline |
Definition at line 2078 of file qcustomplot.h.
|
signal |
This signal is emitted immediately before a replot takes place (caused by a call to the slot replot).
It is safe to mutually connect the replot slot with this signal on two QCustomPlots to make them replot synchronously, it won't cause an infinite recursion.
Referenced by replot().
|
signal |
|
inline |
Definition at line 4233 of file qcustomplot.h.
| int QCustomPlot::clearGraphs | ( | ) |
Removes all graphs from the plot and deletes them. Corresponding legend items are also removed from the default legend (QCustomPlot::legend).
Returns the number of graphs removed.
Removes all graphs from the plot (and the QCustomPlot::legend, if necessary).
Returns the number of graphs removed.
Definition at line 14278 of file qcustomplot.cpp.
References mGraphs, and removeGraph().
Referenced by cvProbeFilter::apply(), cvProbeFilter::createUi(), ccHistogramWindow::refresh(), and ccWaveWidget::refresh().
| int QCustomPlot::clearGraphs | ( | ) |
| int QCustomPlot::clearItems | ( | ) |
Removes all items from the plot and deletes them.
Returns the number of items removed.
Removes all items from the plot.
Returns the number of items removed.
Definition at line 14379 of file qcustomplot.cpp.
References mItems, and removeItem().
Referenced by ~QCustomPlot().
| int QCustomPlot::clearItems | ( | ) |
| int QCustomPlot::clearPlottables | ( | ) |
Removes all plottables from the plot and deletes them. Corresponding legend items are also removed from the default legend (QCustomPlot::legend).
Returns the number of plottables removed.
Removes all plottables from the plot (and the QCustomPlot::legend, if necessary).
Returns the number of plottables removed.
Definition at line 14094 of file qcustomplot.cpp.
References mPlottables, and removePlottable().
Referenced by ccHistogramWindow::refresh(), ccWaveWidget::refresh(), and ~QCustomPlot().
| int QCustomPlot::clearPlottables | ( | ) |
|
protected |
Definition at line 15724 of file qcustomplot.cpp.
References mBufferDevicePixelRatio, mOpenGl, mOpenGlMultisamples, size, and viewport().
Referenced by setupPaintBuffers().
| QCPLayer * QCustomPlot::currentLayer | ( | ) | const |
Returns the layer that is set as current layer (see setCurrentLayer).
Definition at line 14494 of file qcustomplot.cpp.
References mCurrentLayer.
Referenced by addPlottable(), QCPLayerable::QCPLayerable(), QCPPlotTitle::QCPPlotTitle(), registerItem(), registerPlottable(), and QCPLayer::~QCPLayer().
| QCPLayer* QCustomPlot::currentLayer | ( | ) | const |
| void QCustomPlot::deselectAll | ( | ) |
Deselects all layerables (plottables, items, axes, legends,...) of the QCustomPlot.
Since calling this function is not a user interaction, this does not emit the selectionChangedByUser signal. The individual selectionChanged signals are emitted though, if the objects were previously selected.
Definition at line 14874 of file qcustomplot.cpp.
References QCPLayer::children(), QCPLayerable::deselectEvent(), layer(), and mLayers.
| Q_SLOT void QCustomPlot::deselectAll | ( | ) |
|
protectedvirtual |
Definition at line 15571 of file qcustomplot.cpp.
References QCPLayer::draw(), drawBackground(), layer(), mLayers, and updateLayout().
Referenced by savePdf(), toPainter(), and toPixmap().
|
protectedvirtual |
|
protected |
Definition at line 15626 of file qcustomplot.cpp.
References mBackgroundPixmap, mBackgroundScaled, mBackgroundScaledMode, mScaledBackgroundPixmap, and mViewport.
Referenced by draw(), and paintEvent().
|
protected |
|
protected |
Definition at line 15840 of file qcustomplot.cpp.
Referenced by setOpenGl(), and setupOpenGl().
| QCPGraph * QCustomPlot::graph | ( | ) | const |
This is an overloaded member function, provided for convenience. It differs from the above function only in what argument(s) it accepts.
Returns the last graph, that was created with addGraph. If there are no graphs in the plot, returns 0.
Definition at line 14202 of file qcustomplot.cpp.
References mGraphs.
Referenced by addPlottable(), registerGraph(), removeGraph(), removePlottable(), and selectedGraphs().
| QCPGraph* QCustomPlot::graph | ( | ) | const |
| QCPGraph * QCustomPlot::graph | ( | int | index | ) | const |
Returns the graph with index. If the index is invalid, returns 0.
There is an overloaded version of this function with no parameter which returns the last created graph, see QCustomPlot::graph()
Definition at line 14186 of file qcustomplot.cpp.
References mGraphs.
Referenced by cvProbeFilter::apply().
| QCPGraph* QCustomPlot::graph | ( | int | index | ) | const |
| int QCustomPlot::graphCount | ( | ) | const |
Returns the number of currently existing graphs in the plot
Definition at line 14289 of file qcustomplot.cpp.
References mGraphs.
| int QCustomPlot::graphCount | ( | ) | const |
|
protected |
This method returns whether any of the paint buffers held by this QCustomPlot instance are invalidated.
If any buffer is invalidated, a partial replot (QCPLayer::replot) is not allowed and always causes a full replot (QCustomPlot::replot) of all layers. This is the case when for example the layer order has changed, new layers were added, layers were removed, or layer modes were changed (QCPLayer::setMode).
Definition at line 15759 of file qcustomplot.cpp.
References mPaintBuffers.
Referenced by QCPLayer::replot().
| bool QCustomPlot::hasItem | ( | QCPAbstractItem * | item | ) | const |
Returns whether this QCustomPlot contains the item.
Returns whether this QCustomPlot contains the item.
Definition at line 14457 of file qcustomplot.cpp.
| bool QCustomPlot::hasItem | ( | QCPAbstractItem * | item | ) | const |
| bool QCustomPlot::hasPlottable | ( | QCPAbstractPlottable * | plottable | ) | const |
Returns whether this QCustomPlot instance contains the plottable.
Returns whether this QCustomPlot instance contains the plottable.
Definition at line 14174 of file qcustomplot.cpp.
References mPlottables, and plottable().
Referenced by QCPItemTracer::updatePosition().
| bool QCustomPlot::hasPlottable | ( | QCPAbstractPlottable * | plottable | ) | const |
|
inline |
Definition at line 4247 of file qcustomplot.h.
Referenced by QCPAxisRect::mouseMoveEvent(), QCPAxis::mousePressEvent(), QCPAxisRect::mousePressEvent(), setInteractions(), QCPAxis::wheelEvent(), and QCPAxisRect::wheelEvent().
|
inline |
Definition at line 2089 of file qcustomplot.h.
| QCPAbstractItem * QCustomPlot::item | ( | ) | const |
This is an overloaded member function, provided for convenience. It differs from the above function only in what argument(s) it accepts.
Returns the last item that was added to this plot. If there are no items in the plot, returns 0.
This is an overloaded member function, provided for convenience. It differs from the above function only in what argument(s) it accepts.
Returns the last item, that was added with addItem. If there are no items in the plot, returns 0.
Definition at line 14333 of file qcustomplot.cpp.
References mItems.
Referenced by addItem(), hasItem(), itemAt(), registerItem(), removeItem(), and selectedItems().
| QCPAbstractItem* QCustomPlot::item | ( | ) | const |
| QCPAbstractItem * QCustomPlot::item | ( | int | index | ) | const |
Returns the item with index. If the index is invalid, returns 0.
There is an overloaded version of this function with no parameter which returns the last added item, see QCustomPlot::item()
Returns the item with index. If the index is invalid, returns 0.
There is an overloaded version of this function with no parameter which returns the last added item, see QCustomPlot::item()
Definition at line 14317 of file qcustomplot.cpp.
References mItems.
| QCPAbstractItem* QCustomPlot::item | ( | int | index | ) | const |
| QCPAbstractItem * QCustomPlot::itemAt | ( | const QPointF & | pos, |
| bool | onlySelectable = false |
||
| ) | const |
Returns the item at the pixel position pos. Items that only consist of single lines (e.g. QCPItemLine or QCPItemCurve) have a tolerance band around them, see setSelectionTolerance. If multiple items come into consideration, the one closest to pos is returned.
If onlySelectable is true, only items that are selectable (QCPAbstractItem::setSelectable) are considered.
If there is no item at pos, the return value is 0.
Definition at line 14420 of file qcustomplot.cpp.
References QCPAbstractItem::clipRect(), QCPAbstractItem::clipToAxisRect(), item(), mItems, mSelectionTolerance, QCPAbstractItem::selectable(), and QCPAbstractItem::selectTest().
| QCPAbstractItem* QCustomPlot::itemAt | ( | const QPointF & | pos, |
| bool | onlySelectable = false |
||
| ) | const |
|
signal |
This signal is emitted when an item is clicked.
event is the mouse event that caused the click and item is the item that received the click.
Referenced by mouseReleaseEvent().
|
signal |
| int QCustomPlot::itemCount | ( | ) | const |
| int QCustomPlot::itemCount | ( | ) | const |
|
signal |
Referenced by mouseDoubleClickEvent().
|
signal |
| QCPLayer * QCustomPlot::layer | ( | const QString & | name | ) | const |
Returns the layer with the specified name. If there is no layer with the specified name, 0 is returned.
Layer names are case-sensitive.
Definition at line 14469 of file qcustomplot.cpp.
References mLayers, QCPLayer::name(), and name.
Referenced by addLayer(), deselectAll(), draw(), moveLayer(), processPointSelection(), processRectSelection(), QCustomPlot(), removeLayer(), replot(), setCurrentLayer(), QCPLayerable::setLayer(), and setupPaintBuffers().
| QCPLayer* QCustomPlot::layer | ( | const QString & | name | ) | const |
| QCPLayer * QCustomPlot::layer | ( | int | index | ) | const |
This is an overloaded member function, provided for convenience. It differs from the above function only in what argument(s) it accepts.
Returns the layer by index. If the index is invalid, 0 is returned.
Definition at line 14482 of file qcustomplot.cpp.
References mLayers.
| QCPLayer* QCustomPlot::layer | ( | int | index | ) | const |
|
protected |
Definition at line 16181 of file qcustomplot.cpp.
References layerableListAt().
Referenced by processPointSelection().
|
protected |
|
protected |
Definition at line 16216 of file qcustomplot.cpp.
References mLayers, result, and selectionTolerance().
Referenced by layerableAt(), mouseDoubleClickEvent(), mousePressEvent(), and wheelEvent().
| int QCustomPlot::layerCount | ( | ) | const |
Returns the number of currently existing layers in the plot
Definition at line 14542 of file qcustomplot.cpp.
References mLayers.
| int QCustomPlot::layerCount | ( | ) | const |
| QCPLayoutElement * QCustomPlot::layoutElementAt | ( | const QPointF & | pos | ) | const |
Returns the layout element at pixel position pos. If there is no element at that position, returns 0.
Only visible elements are used. If QCPLayoutElement::setVisible on the element itself or on any of its parent elements is set to false, it will not be considered.
Definition at line 14763 of file qcustomplot.cpp.
References QCPLayoutElement::elements(), mPlotLayout, QCPLayerable::realVisibility(), and QCPLayoutElement::selectTest().
| QCPLayoutElement* QCustomPlot::layoutElementAt | ( | const QPointF & | pos | ) | const |
|
signal |
Referenced by mouseReleaseEvent().
|
signal |
|
signal |
This signal is emitted when a legend (item) is double clicked.
event is the mouse event that caused the click, legend is the legend that received the click and item is the legend item that received the click. If only the legend and no item is clicked, item is 0. This happens for a click inside the legend padding or the space between two items.
Referenced by mouseDoubleClickEvent().
|
signal |
|
protectedvirtual |
Definition at line 15869 of file qcustomplot.cpp.
References legend.
Referenced by QCPLegend::~QCPLegend().
|
protectedvirtual |
|
protectedvirtual |
Definition at line 15258 of file qcustomplot.cpp.
References QCPLayoutGrid::minimumOuterSizeHint(), and mPlotLayout.
|
protectedvirtual |
|
signal |
This signal is emitted when the QCustomPlot receives a mouse double click event.
Referenced by mouseDoubleClickEvent().
|
signal |
|
protectedvirtual |
Reimplemented in WolmanCustomPlot, and AnglesCustomPlot.
Definition at line 15314 of file qcustomplot.cpp.
References axisDoubleClick(), event, QCPDataSelection::isEmpty(), itemDoubleClick(), layerableListAt(), legendDoubleClick(), mMouseEventLayerable, mMouseEventLayerableDetails, mMouseHasMoved, mMousePressPos, mouseDoubleClick(), and plottableDoubleClick().
Referenced by AnglesCustomPlot::mouseDoubleClickEvent(), and WolmanCustomPlot::mouseDoubleClickEvent().
|
protectedvirtual |
Reimplemented in WolmanCustomPlot, and AnglesCustomPlot.
|
signal |
This signal is emitted when the QCustomPlot receives a mouse move event.
It is emitted before QCustomPlot handles any other mechanism like range dragging. So a slot connected to this signal can still influence the behaviour e.g. with QCPAxisRect::setRangeDrag or QCPAxisRect::setRangeDragAxes.
Referenced by mouseMoveEvent().
|
signal |
|
protectedvirtual |
Reimplemented in ccWaveWidget, and ccHistogramWindow.
Definition at line 15434 of file qcustomplot.cpp.
References event, QCPSelectionRect::isActive(), mMouseEventLayerable, mMouseHasMoved, mMousePressPos, mouseMove(), QCPSelectionRect::moveSelection(), and mSelectionRect.
|
protectedvirtual |
Reimplemented in ccWaveWidget, and ccHistogramWindow.
|
signal |
This signal is emitted when the QCustomPlot receives a mouse press event.
It is emitted before QCustomPlot handles any other mechanism like range dragging. So a slot connected to this signal can still influence the behaviour e.g. with QCPAxisRect::setRangeDrag or QCPAxisRect::setRangeDragAxes.
Referenced by mousePressEvent().
|
signal |
|
protectedvirtual |
Reimplemented in WolmanCustomPlot, AnglesCustomPlot, ccWaveWidget, and ccHistogramWindow.
Definition at line 15377 of file qcustomplot.cpp.
References axisRectAt(), event, layerableListAt(), mMouseEventLayerable, mMouseEventLayerableDetails, mMouseHasMoved, mMousePressPos, mMouseSignalLayerable, mMouseSignalLayerableDetails, mousePress(), mSelectionRect, mSelectionRectMode, QCP::srmNone, QCP::srmZoom, and QCPSelectionRect::startSelection().
Referenced by AnglesCustomPlot::mousePressEvent(), and WolmanCustomPlot::mousePressEvent().
|
protectedvirtual |
Reimplemented in WolmanCustomPlot, AnglesCustomPlot, ccWaveWidget, and ccHistogramWindow.
|
signal |
This signal is emitted when the QCustomPlot receives a mouse release event.
It is emitted before QCustomPlot handles any other mechanisms like object selection. So a slot connected to this signal can still influence the behaviour e.g. with setInteractions or QCPAbstractPlottable::setSelectable.
Referenced by mouseReleaseEvent().
|
signal |
|
protectedvirtual |
Definition at line 15469 of file qcustomplot.cpp.
References axisClick(), QCPSelectionRect::cancel(), QCPSelectionRect::endSelection(), event, QCPSelectionRect::isActive(), QCPDataSelection::isEmpty(), itemClick(), legendClick(), mMouseEventLayerable, mMouseHasMoved, mMousePressPos, mMouseSignalLayerable, mMouseSignalLayerableDetails, mouseRelease(), mSelectionRect, noAntialiasingOnDrag(), plottableClick(), processPointSelection(), replot(), and rpQueuedReplot.
|
protectedvirtual |
|
signal |
Referenced by wheelEvent().
|
signal |
| bool QCustomPlot::moveLayer | ( | QCPLayer * | layer, |
| QCPLayer * | otherLayer, | ||
| QCustomPlot::LayerInsertMode | insertMode = limAbove |
||
| ) |
Moves the specified layer either above or below otherLayer. Whether it's placed above or below is controlled with insertMode.
Returns true on success, i.e. when both layer and otherLayer are valid layers in the QCustomPlot.
Definition at line 14648 of file qcustomplot.cpp.
References QCPLayer::index(), layer(), limAbove, mLayers, QCPLayer::mPaintBuffer, and updateLayerIndices().
| bool QCustomPlot::moveLayer | ( | QCPLayer * | layer, |
| QCPLayer * | otherLayer, | ||
| LayerInsertMode | insertMode = limAbove |
||
| ) |
|
inline |
Definition at line 4251 of file qcustomplot.h.
|
inline |
Definition at line 2093 of file qcustomplot.h.
|
inline |
Definition at line 4249 of file qcustomplot.h.
Referenced by QCPAxis::mouseMoveEvent(), QCPAxisRect::mouseMoveEvent(), QCPAxis::mousePressEvent(), QCPAxisRect::mousePressEvent(), mouseReleaseEvent(), QCPAxis::mouseReleaseEvent(), and QCPAxisRect::mouseReleaseEvent().
|
inline |
Definition at line 2091 of file qcustomplot.h.
|
inline |
Definition at line 4243 of file qcustomplot.h.
Referenced by QCPLayerable::applyAntialiasingHint(), QCPAxis::mousePressEvent(), QCPAxisRect::mousePressEvent(), and setNotAntialiasedElements().
|
inline |
Definition at line 2085 of file qcustomplot.h.
|
inline |
Definition at line 4258 of file qcustomplot.h.
|
protectedvirtual |
Definition at line 15276 of file qcustomplot.cpp.
References drawBackground(), event, mBackgroundBrush, mPaintBuffers, and mViewport.
|
protectedvirtual |
|
inline |
Returns the top level layout of this QCustomPlot instance. It is a QCPLayoutGrid, initially containing just one cell with the main QCPAxisRect inside.
Definition at line 4239 of file qcustomplot.h.
Referenced by ccHistogramWindow::refresh(), and ccWaveWidget::refresh().
|
inline |
Definition at line 2081 of file qcustomplot.h.
| QCPAbstractPlottable * QCustomPlot::plottable | ( | ) |
This is an overloaded member function, provided for convenience. It differs from the above function only in what argument(s) it accepts.
Returns the last plottable that was added to the plot. If there are no plottables in the plot, returns 0.
This is an overloaded member function, provided for convenience. It differs from the above function only in what argument(s) it accepts.
Returns the last plottable that was added with addPlottable. If there are no plottables in the plot, returns 0.
Definition at line 14039 of file qcustomplot.cpp.
References mPlottables.
Referenced by addPlottable(), hasPlottable(), plottableAt(), processRectSelection(), registerPlottable(), removePlottable(), and selectedPlottables().
| QCPAbstractPlottable* QCustomPlot::plottable | ( | ) |
| QCPAbstractPlottable * QCustomPlot::plottable | ( | int | index | ) |
Returns the plottable with index. If the index is invalid, returns 0.
There is an overloaded version of this function with no parameter which returns the last added plottable, see QCustomPlot::plottable()
Returns the plottable with index. If the index is invalid, returns 0.
There is an overloaded version of this function with no parameter which returns the last added plottable, see QCustomPlot::plottable()
Definition at line 14023 of file qcustomplot.cpp.
References mPlottables.
Referenced by QCPColorScale::colorMaps().
| QCPAbstractPlottable* QCustomPlot::plottable | ( | int | index | ) |
| QCPAbstractPlottable * QCustomPlot::plottableAt | ( | const QPointF & | pos, |
| bool | onlySelectable = false |
||
| ) | const |
Returns the plottable at the pixel position pos. Plottables that only consist of single lines (like graphs) have a tolerance band around them, see setSelectionTolerance. If multiple plottables come into consideration, the one closest to pos is returned.
If onlySelectable is true, only plottables that are selectable (QCPAbstractPlottable::setSelectable) are considered.
If there is no plottable at pos, the return value is 0.
Definition at line 14138 of file qcustomplot.cpp.
References QCPAxis::axisRect(), QCPAbstractPlottable::keyAxis(), mPlottables, mSelectionTolerance, plottable(), QCPLayoutElement::rect(), QCPAbstractPlottable::selectable(), QCPAbstractPlottable::selectTest(), and QCPAbstractPlottable::valueAxis().
| QCPAbstractPlottable* QCustomPlot::plottableAt | ( | const QPointF & | pos, |
| bool | onlySelectable = false |
||
| ) | const |
|
signal |
Referenced by mouseReleaseEvent().
|
signal |
This signal is emitted when a plottable is clicked.
event is the mouse event that caused the click and plottable is the plottable that received the click.
| int QCustomPlot::plottableCount | ( | ) | const |
Returns the number of currently existing plottables in the plot
Returns the number of currently existing plottables in the plot
Definition at line 14105 of file qcustomplot.cpp.
References mPlottables.
Referenced by QCPColorScale::colorMaps().
| int QCustomPlot::plottableCount | ( | ) | const |
|
signal |
This signal is emitted when a plottable is double clicked.
event is the mouse event that caused the click and plottable is the plottable that received the click. The parameter dataIndex indicates the data point that was closest to the click position.
Referenced by mouseDoubleClickEvent().
|
signal |
This signal is emitted when a plottable is double clicked.
event is the mouse event that caused the click and plottable is the plottable that received the click.
|
inline |
Definition at line 4250 of file qcustomplot.h.
Referenced by QCPGraph::drawLinePlot(), and QCPAbstractPlottable1D< DataType >::drawPolyline().
|
inline |
Definition at line 2092 of file qcustomplot.h.
|
protectedvirtual |
Definition at line 16029 of file qcustomplot.cpp.
References QCPLayer::children(), QCPLayerable::deselectEvent(), event, QCP::iMultiSelect, layer(), layerableAt(), mInteractions, mLayers, mMultiSelectModifier, replot(), rpQueuedReplot, QCPLayerable::selectEvent(), QCPLayerable::selectionCategory(), and selectionChangedByUser().
Referenced by mouseReleaseEvent().
|
protectedvirtual |
Definition at line 15892 of file qcustomplot.cpp.
References axisRectAt(), QCPLayer::children(), QCPDataSelection::dataPointCount(), QCPLayerable::deselectEvent(), event, QCP::iMultiSelect, QCPAbstractPlottable::interface1D(), QCP::iSelectPlottables, QCPDataSelection::isEmpty(), QCPLayerable::layer(), layer(), mInteractions, mLayers, mMultiSelectModifier, mSelectionRect, plottable(), QCPLayer::replot(), replot(), rpQueuedReplot, QCPLayerable::selectionCategory(), and selectionChangedByUser().
Referenced by setSelectionRect(), and setSelectionRectMode().
|
protectedvirtual |
Definition at line 15996 of file qcustomplot.cpp.
References axisRect(), axisRectAt(), event, QCPAxisRect::rangeZoomAxes(), replot(), rpQueuedReplot, and QCPAxisRect::zoom().
Referenced by setSelectionRect(), and setSelectionRectMode().
|
protected |
Definition at line 16107 of file qcustomplot.cpp.
References graph(), and mGraphs.
Referenced by QCPGraph::QCPGraph().
|
protected |
Definition at line 16133 of file qcustomplot.cpp.
References currentLayer(), item(), QCPLayerable::layer(), mItems, QCPLayerable::parentPlot(), and QCPLayerable::setLayer().
Referenced by QCPAbstractItem::QCPAbstractItem().
|
protected |
Definition at line 16073 of file qcustomplot.cpp.
References QCPAbstractPlottable::addToLegend(), currentLayer(), QCPLayerable::layer(), mAutoAddPlottableToLegend, mPlottables, QCPLayerable::parentPlot(), plottable(), and QCPLayerable::setLayer().
Referenced by QCPAbstractPlottable::QCPAbstractPlottable().
| bool QCustomPlot::removeGraph | ( | int | index | ) |
This is an overloaded member function, provided for convenience. It differs from the above function only in what argument(s) it accepts.
Removes and deletes the graph by its index.
This is an overloaded member function, provided for convenience. It differs from the above function only in what argument(s) it accepts.
Removes the graph by its index.
Definition at line 14263 of file qcustomplot.cpp.
References mGraphs, and removeGraph().
| bool QCustomPlot::removeGraph | ( | int | index | ) |
| bool QCustomPlot::removeGraph | ( | QCPGraph * | graph | ) |
Removes the specified graph from the plot and deletes it. If necessary, the corresponding legend item is also removed from the default legend (QCustomPlot::legend). If any other graphs in the plot have a channel fill set towards the removed graph, the channel fill property of those graphs is reset to zero (no channel fill).
Returns true on success.
Removes the specified graph from the plot and, if necessary, from the QCustomPlot::legend. If any other graphs in the plot have a channel fill set towards the removed graph, the channel fill property of those graphs is reset to zero (no channel fill).
Returns true on success.
Definition at line 14255 of file qcustomplot.cpp.
References graph(), and removePlottable().
Referenced by clearGraphs(), and removeGraph().
| bool QCustomPlot::removeGraph | ( | QCPGraph * | graph | ) |
| bool QCustomPlot::removeItem | ( | int | index | ) |
This is an overloaded member function, provided for convenience. It differs from the above function only in what argument(s) it accepts.
Removes and deletes the item by its index.
This is an overloaded member function, provided for convenience. It differs from the above function only in what argument(s) it accepts.
Removes the item by its index.
Definition at line 14363 of file qcustomplot.cpp.
References mItems, and removeItem().
| bool QCustomPlot::removeItem | ( | int | index | ) |
| bool QCustomPlot::removeItem | ( | QCPAbstractItem * | item | ) |
Removes the specified item from the plot and deletes it.
Returns true on success.
Removes the specified item from the plot.
Returns true on success.
Definition at line 14347 of file qcustomplot.cpp.
References item(), and mItems.
Referenced by clearItems(), and removeItem().
| bool QCustomPlot::removeItem | ( | QCPAbstractItem * | item | ) |
| bool QCustomPlot::removeLayer | ( | QCPLayer * | layer | ) |
Removes the specified layer and returns true on success.
All layerables (e.g. plottables and items) on the removed layer will be moved to the layer below layer. If layer is the bottom layer, the layerables are moved to the layer above. In both cases, the total rendering order of all layerables in the QCustomPlot is preserved.
If layer is the current layer (setCurrentLayer), the layer below (or above, if bottom layer) becomes the new current layer.
It is not possible to remove the last layer of the plot.
Definition at line 14598 of file qcustomplot.cpp.
References QCPLayer::children(), QCPLayer::index(), layer(), mCurrentLayer, mLayers, QCPLayer::mPaintBuffer, setCurrentLayer(), and updateLayerIndices().
| bool QCustomPlot::removeLayer | ( | QCPLayer * | layer | ) |
| bool QCustomPlot::removePlottable | ( | int | index | ) |
This is an overloaded member function, provided for convenience. It differs from the above function only in what argument(s) it accepts.
Removes and deletes the plottable by its index.
This is an overloaded member function, provided for convenience. It differs from the above function only in what argument(s) it accepts.
Removes the plottable by its index.
Definition at line 14077 of file qcustomplot.cpp.
References mPlottables, and removePlottable().
| bool QCustomPlot::removePlottable | ( | int | index | ) |
| bool QCustomPlot::removePlottable | ( | QCPAbstractPlottable * | plottable | ) |
Removes the specified plottable from the plot and deletes it. If necessary, the corresponding legend item is also removed from the default legend (QCustomPlot::legend).
Returns true on success.
Removes the specified plottable from the plot and, if necessary, from the legend (QCustomPlot::legend).
Returns true on success.
Definition at line 14055 of file qcustomplot.cpp.
References graph(), mGraphs, mPlottables, plottable(), and QCPAbstractPlottable::removeFromLegend().
Referenced by clearPlottables(), AnglesCustomPlot::createQCPBars(), removeGraph(), and removePlottable().
| bool QCustomPlot::removePlottable | ( | QCPAbstractPlottable * | plottable | ) |
| Q_SLOT void QCustomPlot::replot | ( | QCustomPlot::RefreshPriority | refreshPriority = QCustomPlot::rpHint | ) |
| void QCustomPlot::replot | ( | QCustomPlot::RefreshPriority | refreshPriority = QCustomPlot::rpRefreshHint | ) |
Causes a complete replot into the internal paint buffer(s). Finally, the widget surface is refreshed with the new buffer contents. This is the method that must be called to make changes to the plot, e.g. on the axis ranges or data points of graphs, visible.
The parameter refreshPriority can be used to fine-tune the timing of the replot. For example if your application calls replot very quickly in succession (e.g. multiple independent functions change some aspects of the plot and each wants to make sure the change gets replotted), it is advisable to set refreshPriority to QCustomPlot::rpQueuedReplot. This way, the actual replotting is deferred to the next event loop iteration. Multiple successive calls of replot with this priority will only cause a single replot, avoiding redundant replots and improving performance.
Under a few circumstances, QCustomPlot causes a replot by itself. Those are resize events of the QCustomPlot widget and user interactions (object selection and range dragging/zooming).
Before the replot happens, the signal beforeReplot is emitted. After the replot, afterReplot is emitted. It is safe to mutually connect the replot slot with any of those two signals on two QCustomPlots to make them replot synchronously, it won't cause an infinite recursion.
If a layer is in mode QCPLayer::lmBuffered (QCPLayer::setMode), it is also possible to replot only that specific layer via QCPLayer::replot. See the documentation there for details.
Causes a complete replot into the internal buffer. Finally, update() is called, to redraw the buffer on the QCustomPlot widget surface. This is the method that must be called to make changes, for example on the axis ranges or data points of graphs, visible.
Under a few circumstances, QCustomPlot causes a replot by itself. Those are resize events of the QCustomPlot widget and user interactions (object selection and range dragging/zooming).
Before the replot happens, the signal beforeReplot is emitted. After the replot, afterReplot is emitted. It is safe to mutually connect the replot slot with any of those two signals on two QCustomPlots to make them replot synchronously, it won't cause an infinite recursion.
Definition at line 14909 of file qcustomplot.cpp.
References afterReplot(), beforeReplot(), QCPLayer::drawToPaintBuffer(), layer(), mLayers, mPaintBuffers, mPlottingHints, mReplotQueued, mReplotting, QCP::phImmediateRefresh, rpImmediateRefresh, rpQueuedReplot, rpRefreshHint, setupPaintBuffers(), and updateLayout().
Referenced by cvProbeFilter::apply(), QCPAxis::mouseMoveEvent(), QCPAxisRect::mouseMoveEvent(), mouseReleaseEvent(), processPointSelection(), processRectSelection(), processRectZoom(), QCustomPlot(), ccHistogramWindow::refresh(), ccWaveWidget::refresh(), ccHistogramWindow::refreshBars(), QCPLayer::replot(), AnglesCustomPlot::rescale(), WolmanCustomPlot::rescale(), resizeEvent(), ccHistogramWindow::setMaxDispValue(), ccHistogramWindow::setMaxSatValue(), ccHistogramWindow::setMinDispValue(), ccHistogramWindow::setMinSatValue(), ccColorFromScalarDlg::updateHistogram(), QCPAxis::wheelEvent(), and QCPAxisRect::wheelEvent().
| void QCustomPlot::rescaleAxes | ( | bool | onlyVisiblePlottables = false | ) |
Rescales the axes such that all plottables (like graphs) in the plot are fully visible.
if onlyVisiblePlottables is set to true, only the plottables that have their visibility set to true (QCPLayerable::setVisible), will be used to rescale the axes.
Definition at line 14953 of file qcustomplot.cpp.
References QCPAxisRect::axes(), axisRects(), and QCPAxis::rescale().
| Q_SLOT void QCustomPlot::rescaleAxes | ( | bool | onlyVisiblePlottables = false | ) |
|
protectedvirtual |
Reimplemented in ccWaveWidget, and ccHistogramWindow.
Definition at line 15296 of file qcustomplot.cpp.
References event, replot(), rpQueuedRefresh, and setViewport().
Referenced by ccHistogramWindow::resizeEvent(), and ccWaveWidget::resizeEvent().
|
protectedvirtual |
Reimplemented in ccWaveWidget, and ccHistogramWindow.
| bool QCustomPlot::saveBmp | ( | const QString & | fileName, |
| int | width = 0, |
||
| int | height = 0, |
||
| double | scale = 1.0 |
||
| ) |
Saves a BMP image file to fileName on disc. The output plot will have the dimensions width and height in pixels. If either width or height is zero, the exported image will have the same dimensions as the QCustomPlot widget currently has. Line widths and texts etc. are not scaled up when larger widths/heights are used. If you want that effect, use the scale parameter.
For example, if you set both width and height to 100 and scale to 2, you will end up with an image file of size 200*200 in which all graphical elements are scaled up by factor 2 (line widths, texts, etc.). This scaling is not done by stretching a 100*100 image, the result will have full 200*200 pixel resolution.
If you use a high scaling factor, it is recommended to enable antialiasing for all elements via temporarily setting QCustomPlot::setAntialiasedElements to QCP::aeAll as this allows QCustomPlot to place objects with sub-pixel accuracy.
The objects of the plot will appear in the current selection state. If you don't want any selected objects to be painted in their selected look, deselect everything with deselectAll before calling this function.
Returns true on success. If this function fails, most likely the BMP format isn't supported by the system, see Qt docs about QImageWriter::supportedImageFormats().
Definition at line 10978 of file qcustomplot.cpp.
References height, saveRastered(), and width.
| bool QCustomPlot::saveBmp | ( | const QString & | fileName, |
| int | width = 0, |
||
| int | height = 0, |
||
| double | scale = 1.0, |
||
| int | resolution = 96, |
||
| QCP::ResolutionUnit | resolutionUnit = QCP::ruDotsPerInch |
||
| ) |
Saves a BMP image file to fileName on disc. The output plot will have the dimensions width and height in pixels, multiplied by scale. If either width or height is zero, the current width and height of the QCustomPlot widget is used instead. Line widths and texts etc. are not scaled up when larger widths/heights are used. If you want that effect, use the scale parameter.
For example, if you set both width and height to 100 and scale to 2, you will end up with an image file of size 200*200 in which all graphical elements are scaled up by factor 2 (line widths, texts, etc.). This scaling is not done by stretching a 100*100 image, the result will have full 200*200 pixel resolution.
If you use a high scaling factor, it is recommended to enable antialiasing for all elements by temporarily setting QCustomPlot::setAntialiasedElements to QCP::aeAll as this allows QCustomPlot to place objects with sub-pixel accuracy.
The resolution will be written to the image file header and has no direct consequence for the quality or the pixel size. However, if opening the image with a tool which respects the metadata, it will be able to scale the image to match either a given size in real units of length (inch, centimeters, etc.), or the target display DPI. You can specify in which units resolution is given, by setting resolutionUnit. The resolution is converted to the format's expected resolution unit internally.
Returns true on success. If this function fails, most likely the BMP format isn't supported by the system, see Qt docs about QImageWriter::supportedImageFormats().
The objects of the plot will appear in the current selection state. If you don't want any selected objects to be painted in their selected look, deselect everything with deselectAll before calling this function.
Definition at line 15238 of file qcustomplot.cpp.
References height, saveRastered(), and width.
Referenced by cvProbeFilter::getOutput().
| bool QCustomPlot::saveJpg | ( | const QString & | fileName, |
| int | width = 0, |
||
| int | height = 0, |
||
| double | scale = 1.0, |
||
| int | quality = -1 |
||
| ) |
Saves a JPG image file to fileName on disc. The output plot will have the dimensions width and height in pixels. If either width or height is zero, the exported image will have the same dimensions as the QCustomPlot widget currently has. Line widths and texts etc. are not scaled up when larger widths/heights are used. If you want that effect, use the scale parameter.
For example, if you set both width and height to 100 and scale to 2, you will end up with an image file of size 200*200 in which all graphical elements are scaled up by factor 2 (line widths, texts, etc.). This scaling is not done by stretching a 100*100 image, the result will have full 200*200 pixel resolution.
If you use a high scaling factor, it is recommended to enable antialiasing for all elements via temporarily setting QCustomPlot::setAntialiasedElements to QCP::aeAll as this allows QCustomPlot to place objects with sub-pixel accuracy.
The objects of the plot will appear in the current selection state. If you don't want any selected objects to be painted in their selected look, deselect everything with deselectAll before calling this function.
JPG compression can be controlled with the quality parameter which must be between 0 and 100 or -1 to use the default setting.
Returns true on success. If this function fails, most likely the JPG format isn't supported by the system, see Qt docs about QImageWriter::supportedImageFormats().
Definition at line 10934 of file qcustomplot.cpp.
References height, saveRastered(), and width.
| bool QCustomPlot::saveJpg | ( | const QString & | fileName, |
| int | width = 0, |
||
| int | height = 0, |
||
| double | scale = 1.0, |
||
| int | quality = -1, |
||
| int | resolution = 96, |
||
| QCP::ResolutionUnit | resolutionUnit = QCP::ruDotsPerInch |
||
| ) |
Saves a JPEG image file to fileName on disc. The output plot will have the dimensions width and height in pixels, multiplied by scale. If either width or height is zero, the current width and height of the QCustomPlot widget is used instead. Line widths and texts etc. are not scaled up when larger widths/heights are used. If you want that effect, use the scale parameter.
For example, if you set both width and height to 100 and scale to 2, you will end up with an image file of size 200*200 in which all graphical elements are scaled up by factor 2 (line widths, texts, etc.). This scaling is not done by stretching a 100*100 image, the result will have full 200*200 pixel resolution.
If you use a high scaling factor, it is recommended to enable antialiasing for all elements by temporarily setting QCustomPlot::setAntialiasedElements to QCP::aeAll as this allows QCustomPlot to place objects with sub-pixel accuracy.
image compression can be controlled with the quality parameter which must be between 0 and 100 or -1 to use the default setting.
The resolution will be written to the image file header and has no direct consequence for the quality or the pixel size. However, if opening the image with a tool which respects the metadata, it will be able to scale the image to match either a given size in real units of length (inch, centimeters, etc.), or the target display DPI. You can specify in which units resolution is given, by setting resolutionUnit. The resolution is converted to the format's expected resolution unit internally.
Returns true on success. If this function fails, most likely the JPEG format isn't supported by the system, see Qt docs about QImageWriter::supportedImageFormats().
The objects of the plot will appear in the current selection state. If you don't want any selected objects to be painted in their selected look, deselect everything with deselectAll before calling this function.
Definition at line 15182 of file qcustomplot.cpp.
References height, saveRastered(), and width.
| bool QCustomPlot::savePdf | ( | const QString & | fileName, |
| bool | noCosmeticPen = false, |
||
| int | width = 0, |
||
| int | height = 0, |
||
| const QString & | pdfCreator = QString(), |
||
| const QString & | pdfTitle = QString() |
||
| ) |
Saves a PDF with the vectorized plot to the file fileName. The axis ratio as well as the scale of texts and lines will be derived from the specified width and height. This means, the output will look like the normal on-screen output of a QCustomPlot widget with the corresponding pixel width and height. If either width or height is zero, the exported image will have the same dimensions as the QCustomPlot widget currently has.
noCosmeticPen disables the use of cosmetic pens when drawing to the PDF file. Cosmetic pens are pens with numerical width 0, which are always drawn as a one pixel wide line, no matter what zoom factor is set in the PDF-Viewer. For more information about cosmetic pens, see the QPainter and QPen documentation.
The objects of the plot will appear in the current selection state. If you don't want any selected objects to be painted in their selected look, deselect everything with deselectAll before calling this function.
Returns true on success.
Definition at line 10774 of file qcustomplot.cpp.
References QCPPainter::begin(), draw(), height, mBackgroundBrush, mViewport, QCPPainter::pmNoCaching, QCPPainter::pmNonCosmetic, QCPPainter::pmVectorized, QCPPainter::setMode(), setViewport(), size, viewport(), ecvColor::white(), and width.
| bool QCustomPlot::savePdf | ( | const QString & | fileName, |
| int | width = 0, |
||
| int | height = 0, |
||
| QCP::ExportPen | exportPen = QCP::epAllowCosmetic, |
||
| const QString & | pdfCreator = QString(), |
||
| const QString & | pdfTitle = QString() |
||
| ) |
Saves a PDF with the vectorized plot to the file fileName. The axis ratio as well as the scale of texts and lines will be derived from the specified width and height. This means, the output will look like the normal on-screen output of a QCustomPlot widget with the corresponding pixel width and height. If either width or height is zero, the exported image will have the same dimensions as the QCustomPlot widget currently has.
Setting exportPen to QCP::epNoCosmetic allows to disable the use of cosmetic pens when drawing to the PDF file. Cosmetic pens are pens with numerical width 0, which are always drawn as a one pixel wide line, no matter what zoom factor is set in the PDF-Viewer. For more information about cosmetic pens, see the QPainter and QPen documentation.
The objects of the plot will appear in the current selection state. If you don't want any selected objects to be painted in their selected look, deselect everything with deselectAll before calling this function.
Returns true on success.
QT_NO_PRINTER is set.Definition at line 15001 of file qcustomplot.cpp.
References QCPPainter::begin(), draw(), QCP::epNoCosmetic, height, mBackgroundBrush, mViewport, QCPPainter::pmNoCaching, QCPPainter::pmNonCosmetic, QCPPainter::pmVectorized, QCPPainter::setMode(), setViewport(), size, viewport(), ecvColor::white(), and width.
Referenced by cvProbeFilter::getOutput().
| bool QCustomPlot::savePng | ( | const QString & | fileName, |
| int | width = 0, |
||
| int | height = 0, |
||
| double | scale = 1.0, |
||
| int | quality = -1 |
||
| ) |
Saves a PNG image file to fileName on disc. The output plot will have the dimensions width and height in pixels. If either width or height is zero, the exported image will have the same dimensions as the QCustomPlot widget currently has. Line widths and texts etc. are not scaled up when larger widths/heights are used. If you want that effect, use the scale parameter.
For example, if you set both width and height to 100 and scale to 2, you will end up with an image file of size 200*200 in which all graphical elements are scaled up by factor 2 (line widths, texts, etc.). This scaling is not done by stretching a 100*100 image, the result will have full 200*200 pixel resolution.
If you use a high scaling factor, it is recommended to enable antialiasing for all elements via temporarily setting QCustomPlot::setAntialiasedElements to QCP::aeAll as this allows QCustomPlot to place objects with sub-pixel accuracy.
The objects of the plot will appear in the current selection state. If you don't want any selected objects to be painted in their selected look, deselect everything with deselectAll before calling this function.
If you want the PNG to have a transparent background, call setBackground(const QBrush &brush) with no brush (Qt::NoBrush) or a transparent color (Qt::transparent), before saving.
PNG compression can be controlled with the quality parameter which must be between 0 and 100 or -1 to use the default setting.
Returns true on success. If this function fails, most likely the PNG format isn't supported by the system, see Qt docs about QImageWriter::supportedImageFormats().
Definition at line 10887 of file qcustomplot.cpp.
References height, saveRastered(), and width.
| bool QCustomPlot::savePng | ( | const QString & | fileName, |
| int | width = 0, |
||
| int | height = 0, |
||
| double | scale = 1.0, |
||
| int | quality = -1, |
||
| int | resolution = 96, |
||
| QCP::ResolutionUnit | resolutionUnit = QCP::ruDotsPerInch |
||
| ) |
Saves a PNG image file to fileName on disc. The output plot will have the dimensions width and height in pixels, multiplied by scale. If either width or height is zero, the current width and height of the QCustomPlot widget is used instead. Line widths and texts etc. are not scaled up when larger widths/heights are used. If you want that effect, use the scale parameter.
For example, if you set both width and height to 100 and scale to 2, you will end up with an image file of size 200*200 in which all graphical elements are scaled up by factor 2 (line widths, texts, etc.). This scaling is not done by stretching a 100*100 image, the result will have full 200*200 pixel resolution.
If you use a high scaling factor, it is recommended to enable antialiasing for all elements by temporarily setting QCustomPlot::setAntialiasedElements to QCP::aeAll as this allows QCustomPlot to place objects with sub-pixel accuracy.
image compression can be controlled with the quality parameter which must be between 0 and 100 or -1 to use the default setting.
The resolution will be written to the image file header and has no direct consequence for the quality or the pixel size. However, if opening the image with a tool which respects the metadata, it will be able to scale the image to match either a given size in real units of length (inch, centimeters, etc.), or the target display DPI. You can specify in which units resolution is given, by setting resolutionUnit. The resolution is converted to the format's expected resolution unit internally.
Returns true on success. If this function fails, most likely the PNG format isn't supported by the system, see Qt docs about QImageWriter::supportedImageFormats().
The objects of the plot will appear in the current selection state. If you don't want any selected objects to be painted in their selected look, deselect everything with deselectAll before calling this function.
If you want the PNG to have a transparent background, call setBackground(const QBrush &brush) with no brush (Qt::NoBrush) or a transparent color (Qt::transparent), before saving.
Definition at line 15123 of file qcustomplot.cpp.
References height, saveRastered(), and width.
Referenced by cvProbeFilter::getOutput().
| bool QCustomPlot::saveRastered | ( | const QString & | fileName, |
| int | width, | ||
| int | height, | ||
| double | scale, | ||
| const char * | format, | ||
| int | quality = -1 |
||
| ) |
Saves the plot to a rastered image file fileName in the image format format. The plot is sized to width and height in pixels and scaled with scale. (width 100 and scale 2.0 lead to a full resolution file with width 200.) If the format supports compression, quality may be between 0 and 100 to control it.
Returns true on success. If this function fails, most likely the given format isn't supported by the system, see Qt docs about QImageWriter::supportedImageFormats().
Definition at line 11412 of file qcustomplot.cpp.
References format, height, toPixmap(), and width.
| bool QCustomPlot::saveRastered | ( | const QString & | fileName, |
| int | width, | ||
| int | height, | ||
| double | scale, | ||
| const char * | format, | ||
| int | quality = -1, |
||
| int | resolution = 96, |
||
| QCP::ResolutionUnit | resolutionUnit = QCP::ruDotsPerInch |
||
| ) |
Saves the plot to a rastered image file fileName in the image format format. The plot is sized to width and height in pixels and scaled with scale. (width 100 and scale 2.0 lead to a full resolution file with width 200.) If the format supports compression, quality may be between 0 and 100 to control it.
Returns true on success. If this function fails, most likely the given format isn't supported by the system, see Qt docs about QImageWriter::supportedImageFormats().
The resolution will be written to the image file header (if the file format supports this) and has no direct consequence for the quality or the pixel size. However, if opening the image with a tool which respects the metadata, it will be able to scale the image to match either a given size in real units of length (inch, centimeters, etc.), or the target display DPI. You can specify in which units resolution is given, by setting resolutionUnit. The resolution is converted to the format's expected resolution unit internally.
Definition at line 16260 of file qcustomplot.cpp.
References format, height, QCP::ruDotsPerCentimeter, QCP::ruDotsPerInch, QCP::ruDotsPerMeter, toPixmap(), and width.
| QList< QCPAxis * > QCustomPlot::selectedAxes | ( | ) | const |
Returns the axes that currently have selected parts, i.e. whose selection state is not QCPAxis::spNone.
Definition at line 14822 of file qcustomplot.cpp.
References QCPAxisRect::axes(), axisRects(), result, QCPAxis::selectedParts(), and QCPAxis::spNone.
| QList<QCPAxis *> QCustomPlot::selectedAxes | ( | ) | const |
| QList< QCPGraph * > QCustomPlot::selectedGraphs | ( | ) | const |
Returns a list of the selected graphs. If no graphs are currently selected, the list is empty.
If you are not only interested in selected graphs but other plottables like QCPCurve, QCPBars, etc., use selectedPlottables.
Returns a list of the selected graphs. If no graphs are currently selected, the list is empty.
If you are not only interested in selected graphs but other plottables like QCPCurve, QCPBars, etc., use selectedPlottables.
Definition at line 14301 of file qcustomplot.cpp.
References graph(), mGraphs, result, and QCPAbstractPlottable::selected().
| QList<QCPGraph *> QCustomPlot::selectedGraphs | ( | ) | const |
| QList< QCPAbstractItem * > QCustomPlot::selectedItems | ( | ) | const |
Returns a list of the selected items. If no items are currently selected, the list is empty.
Definition at line 14399 of file qcustomplot.cpp.
References item(), mItems, result, and QCPAbstractItem::selected().
| QList<QCPAbstractItem *> QCustomPlot::selectedItems | ( | ) | const |
| QList< QCPLegend * > QCustomPlot::selectedLegends | ( | ) | const |
Returns the legends that currently have selected parts, i.e. whose selection state is not QCPLegend::spNone.
Definition at line 14841 of file qcustomplot.cpp.
References QCPLayoutElement::elements(), mPlotLayout, result, and QCPLegend::spNone.
| QList<QCPLegend *> QCustomPlot::selectedLegends | ( | ) | const |
| QList< QCPAbstractPlottable * > QCustomPlot::selectedPlottables | ( | ) | const |
Returns a list of the selected plottables. If no plottables are currently selected, the list is empty.
There is a convenience function if you're only interested in selected graphs, see selectedGraphs.
Returns a list of the selected plottables. If no plottables are currently selected, the list is empty.
There is a convenience function if you're only interested in selected graphs, see selectedGraphs.
Definition at line 14117 of file qcustomplot.cpp.
References mPlottables, plottable(), result, and QCPAbstractPlottable::selected().
| QList<QCPAbstractPlottable *> QCustomPlot::selectedPlottables | ( | ) | const |
|
signal |
This signal is emitted after the user has changed the selection in the QCustomPlot, e.g. by clicking. It is not emitted when the selection state of an object has changed programmatically by a direct call to setSelected()/setSelection() on an object or by calling deselectAll.
In addition to this signal, selectable objects also provide individual signals, for example QCPAxis::selectionChanged or QCPAbstractPlottable::selectionChanged. Note that those signals are emitted even if the selection state is changed programmatically.
See the documentation of setInteractions for details about the selection mechanism.
This signal is emitted after the user has changed the selection in the QCustomPlot, e.g. by clicking. It is not emitted when the selection state of an object has changed programmatically by a direct call to setSelected() on an object or by calling deselectAll.
In addition to this signal, selectable objects also provide individual signals, for example QCPAxis::selectionChanged or QCPAbstractPlottable::selectionChanged. Note that those signals are emitted even if the selection state is changed programmatically.
See the documentation of setInteractions for details about the selection mechanism.
Referenced by processPointSelection(), and processRectSelection().
|
signal |
|
inline |
Allows access to the currently used QCPSelectionRect instance (or subclass thereof), that is used to handle and draw selection rect interactions (see setSelectionRectMode).
Definition at line 4257 of file qcustomplot.h.
Referenced by setSelectionRect().
|
inline |
Definition at line 4254 of file qcustomplot.h.
|
inline |
Definition at line 4248 of file qcustomplot.h.
Referenced by QCPFinancial::candlestickSelectTest(), layerableListAt(), QCPCurve::pointDistance(), QCPGraph::pointDistance(), QCPAbstractItem::rectDistance(), QCPAbstractItem::rectSelectTest(), QCPLayoutElement::selectTest(), QCPLayoutInset::selectTest(), QCPAxis::selectTest(), QCPAbstractPlottable1D< DataType >::selectTest(), QCPAbstractLegendItem::selectTest(), QCPLegend::selectTest(), QCPTextElement::selectTest(), QCPBars::selectTest(), QCPStatisticalBox::selectTest(), QCPColorMap::selectTest(), QCPItemEllipse::selectTest(), QCPItemTracer::selectTest(), and QCPPlotTitle::selectTest().
|
inline |
Definition at line 2090 of file qcustomplot.h.
| void QCustomPlot::setAntialiasedElement | ( | QCP::AntialiasedElement | antialiasedElement, |
| bool | enabled = true |
||
| ) |
Sets whether the specified antialiasedElement is forcibly drawn antialiased.
See setAntialiasedElements for details.
Definition at line 13486 of file qcustomplot.cpp.
References mAntialiasedElements, and mNotAntialiasedElements.
| void QCustomPlot::setAntialiasedElement | ( | QCP::AntialiasedElement | antialiasedElement, |
| bool | enabled = true |
||
| ) |
| void QCustomPlot::setAntialiasedElements | ( | const QCP::AntialiasedElements & | antialiasedElements | ) |
Sets which elements are forcibly drawn antialiased as an or combination of QCP::AntialiasedElement.
This overrides the antialiasing settings for whole element groups, normally controlled with the setAntialiasing function on the individual elements. If an element is neither specified in setAntialiasedElements nor in setNotAntialiasedElements, the antialiasing setting on each individual element instance is used.
For example, if antialiasedElements contains QCP::aePlottables, all plottables will be drawn antialiased, no matter what the specific QCPAbstractPlottable::setAntialiased value was set to.
if an element in antialiasedElements is already set in setNotAntialiasedElements, it is removed from there.
Definition at line 13468 of file qcustomplot.cpp.
References antialiasedElements(), mAntialiasedElements, and mNotAntialiasedElements.
Referenced by ccHistogramWindow::ccHistogramWindow(), QCPAxis::mouseReleaseEvent(), QCPAxisRect::mouseReleaseEvent(), and setOpenGl().
| void QCustomPlot::setAntialiasedElements | ( | const QCP::AntialiasedElements & | antialiasedElements | ) |
| void QCustomPlot::setAutoAddPlottableToLegend | ( | bool | on | ) |
If set to true, adding a plottable (e.g. a graph) to the QCustomPlot automatically also adds the plottable to the legend (QCustomPlot::legend).
If set to true, adding a plottable (e.g. a graph) to the QCustomPlot automatically also adds the plottable to the legend (QCustomPlot::legend).
Definition at line 13556 of file qcustomplot.cpp.
References mAutoAddPlottableToLegend.
Referenced by ccHistogramWindow::ccHistogramWindow(), and ccWaveWidget::ccWaveWidget().
| void QCustomPlot::setAutoAddPlottableToLegend | ( | bool | on | ) |
| void QCustomPlot::setBackground | ( | const QBrush & | brush | ) |
Sets the background brush of the viewport (see setViewport).
Before drawing everything else, the background is filled with brush. If a background pixmap was set with setBackground(const QPixmap &pm), this brush will be used to fill the viewport before the background pixmap is drawn. This can be useful for background pixmaps with translucent areas.
Set brush to Qt::NoBrush or Qt::Transparent to leave background transparent. This can be useful for exporting to image formats which support transparency, e.g. savePng.
Definition at line 13968 of file qcustomplot.cpp.
References mBackgroundBrush.
| void QCustomPlot::setBackground | ( | const QBrush & | brush | ) |
| void QCustomPlot::setBackground | ( | const QPixmap & | pm | ) |
Sets pm as the viewport background pixmap (see setViewport). The pixmap is always drawn below all other objects in the plot.
For cases where the provided pixmap doesn't have the same size as the viewport, scaling can be enabled with setBackgroundScaled and the scaling mode (whether and how the aspect ratio is preserved) can be set with setBackgroundScaledMode. To set all these options in one call, consider using the overloaded version of this function.
If a background brush was set with setBackground(const QBrush &brush), the viewport will first be filled with that brush, before drawing the background pixmap. This can be useful for background pixmaps with translucent areas.
Definition at line 13949 of file qcustomplot.cpp.
References mBackgroundPixmap, and mScaledBackgroundPixmap.
| void QCustomPlot::setBackground | ( | const QPixmap & | pm | ) |
| void QCustomPlot::setBackground | ( | const QPixmap & | pm, |
| bool | scaled, | ||
| Qt::AspectRatioMode | mode = Qt::KeepAspectRatioByExpanding |
||
| ) |
This is an overloaded member function, provided for convenience. It differs from the above function only in what argument(s) it accepts.
Allows setting the background pixmap of the viewport, whether it shall be scaled and how it shall be scaled in one call.
Definition at line 13980 of file qcustomplot.cpp.
References mBackgroundPixmap, mBackgroundScaled, mBackgroundScaledMode, and mScaledBackgroundPixmap.
| void QCustomPlot::setBackground | ( | const QPixmap & | pm, |
| bool | scaled, | ||
| Qt::AspectRatioMode | mode = Qt::KeepAspectRatioByExpanding |
||
| ) |
| void QCustomPlot::setBackgroundScaled | ( | bool | scaled | ) |
Sets whether the viewport background pixmap shall be scaled to fit the viewport. If scaled is set to true, control whether and how the aspect ratio of the original pixmap is preserved with setBackgroundScaledMode.
Note that the scaled version of the original pixmap is buffered, so there is no performance penalty on replots. (Except when the viewport dimensions are changed continuously.)
Definition at line 14000 of file qcustomplot.cpp.
References mBackgroundScaled.
| void QCustomPlot::setBackgroundScaled | ( | bool | scaled | ) |
| void QCustomPlot::setBackgroundScaledMode | ( | Qt::AspectRatioMode | mode | ) |
If scaling of the viewport background pixmap is enabled (setBackgroundScaled), use this function to define whether and how the aspect ratio of the original pixmap is preserved.
Definition at line 14011 of file qcustomplot.cpp.
References mBackgroundScaledMode.
| void QCustomPlot::setBackgroundScaledMode | ( | Qt::AspectRatioMode | mode | ) |
| void QCustomPlot::setBufferDevicePixelRatio | ( | double | ratio | ) |
Sets the device pixel ratio used by the paint buffers of this QCustomPlot instance.
Normally, this doesn't need to be set manually, because it is initialized with the regular QWidget::devicePixelRatio which is configured by Qt to fit the display device (e.g. 1 for normal displays, 2 for High-DPI displays).
Device pixel ratios are supported by Qt only for Qt versions since 5.4. If this method is called when QCustomPlot is being used with older Qt versions, outputs an according qDebug message and leaves the internal buffer device pixel ratio at 1.0.
Definition at line 13915 of file qcustomplot.cpp.
References mBufferDevicePixelRatio, and mPaintBuffers.
Referenced by QCustomPlot().
| bool QCustomPlot::setCurrentLayer | ( | const QString & | name | ) |
Sets the layer with the specified name to be the current layer. All layerables (QCPLayerable), e.g. plottables and items, are created on the current layer.
Returns true on success, i.e. if there is a layer with the specified name in the QCustomPlot.
Layer names are case-sensitive.
Definition at line 14508 of file qcustomplot.cpp.
Referenced by QCustomPlot(), and removeLayer().
| bool QCustomPlot::setCurrentLayer | ( | const QString & | name | ) |
| bool QCustomPlot::setCurrentLayer | ( | QCPLayer * | layer | ) |
This is an overloaded member function, provided for convenience. It differs from the above function only in what argument(s) it accepts.
Sets the provided layer to be the current layer.
Returns true on success, i.e. when layer is a valid layer in the QCustomPlot.
Definition at line 14526 of file qcustomplot.cpp.
References layer(), mCurrentLayer, and mLayers.
| bool QCustomPlot::setCurrentLayer | ( | QCPLayer * | layer | ) |
| void QCustomPlot::setInteraction | ( | const QCP::Interaction & | interaction, |
| bool | enabled = true |
||
| ) |
Sets the single interaction of this QCustomPlot to enabled.
For details about the interaction system, see setInteractions.
Definition at line 13634 of file qcustomplot.cpp.
References mInteractions.
| void QCustomPlot::setInteraction | ( | const QCP::Interaction & | interaction, |
| bool | enabled = true |
||
| ) |
| void QCustomPlot::setInteractions | ( | const QCP::Interactions & | interactions | ) |
Sets the possible interactions of this QCustomPlot as an or-combination of QCP::Interaction enums. There are the following types of interactions:
Axis range manipulation is controlled via QCP::iRangeDrag and QCP::iRangeZoom. When the respective interaction is enabled, the user may drag axes ranges and zoom with the mouse wheel. For details how to control which axes the user may drag/zoom and in what orientations, see QCPAxisRect::setRangeDrag, QCPAxisRect::setRangeZoom, QCPAxisRect::setRangeDragAxes, QCPAxisRect::setRangeZoomAxes.
Plottable data selection is controlled by QCP::iSelectPlottables. If QCP::iSelectPlottables is set, the user may select plottables (graphs, curves, bars,...) and their data by clicking on them or in their vicinity (setSelectionTolerance). Whether the user can actually select a plottable and its data can further be restricted with the QCPAbstractPlottable::setSelectable method on the specific plottable. For details, see the special page about the data selectionmechanism". To retrieve a list of all currently selected plottables, call selectedPlottables. If you're only interested in QCPGraphs, you may use the convenience function selectedGraphs.
Item selection is controlled by QCP::iSelectItems. If QCP::iSelectItems is set, the user may select items (QCPItemLine, QCPItemText,...) by clicking on them or in their vicinity. To find out whether a specific item is selected, call QCPAbstractItem::selected(). To retrieve a list of all currently selected items, call selectedItems.
Axis selection is controlled with QCP::iSelectAxes. If QCP::iSelectAxes is set, the user may select parts of the axes by clicking on them. What parts exactly (e.g. Axis base line, tick labels, axis label) are selectable can be controlled via QCPAxis::setSelectableParts for each axis. To retrieve a list of all axes that currently contain selected parts, call selectedAxes. Which parts of an axis are selected, can be retrieved with QCPAxis::selectedParts().
Legend selection is controlled with QCP::iSelectLegend. If this is set, the user may select the legend itself or individual items by clicking on them. What parts exactly are selectable can be controlled via QCPLegend::setSelectableParts. To find out whether the legend or any of its child items are selected, check the value of QCPLegend::selectedParts. To find out which child items are selected, call QCPLegend::selectedItems.
All other selectable elements The selection of all other selectable objects (e.g. QCPTextElement, or your own layerable subclasses) is controlled with QCP::iSelectOther. If set, the user may select those objects by clicking on them. To find out which are currently selected, you need to check their selected state explicitly.
If the selection state has changed by user interaction, the selectionChangedByUser signal is emitted. Each selectable object additionally emits an individual selectionChanged signal whenever their selection state has changed, i.e. not only by user interaction.
To allow multiple objects to be selected by holding the selection modifier (setMultiSelectModifier), set the flag QCP::iMultiSelect.
Sets the possible interactions of this QCustomPlot as an or-combination of QCP::Interaction enums. There are the following types of interactions:
Axis range manipulation is controlled via QCP::iRangeDrag and QCP::iRangeZoom. When the respective interaction is enabled, the user may drag axes ranges and zoom with the mouse wheel. For details how to control which axes the user may drag/zoom and in what orientations, see QCPAxisRect::setRangeDrag, QCPAxisRect::setRangeZoom, QCPAxisRect::setRangeDragAxes, QCPAxisRect::setRangeZoomAxes.
Plottable selection is controlled by QCP::iSelectPlottables. If QCP::iSelectPlottables is set, the user may select plottables (graphs, curves, bars,...) by clicking on them or in their vicinity (setSelectionTolerance). Whether the user can actually select a plottable can further be restricted with the QCPAbstractPlottable::setSelectable function on the specific plottable. To find out whether a specific plottable is selected, call QCPAbstractPlottable::selected(). To retrieve a list of all currently selected plottables, call selectedPlottables. If you're only interested in QCPGraphs, you may use the convenience function selectedGraphs.
Item selection is controlled by QCP::iSelectItems. If QCP::iSelectItems is set, the user may select items (QCPItemLine, QCPItemText,...) by clicking on them or in their vicinity. To find out whether a specific item is selected, call QCPAbstractItem::selected(). To retrieve a list of all currently selected items, call selectedItems.
Axis selection is controlled with QCP::iSelectAxes. If QCP::iSelectAxes is set, the user may select parts of the axes by clicking on them. What parts exactly (e.g. Axis base line, tick labels, axis label) are selectable can be controlled via QCPAxis::setSelectableParts for each axis. To retrieve a list of all axes that currently contain selected parts, call selectedAxes. Which parts of an axis are selected, can be retrieved with QCPAxis::selectedParts().
Legend selection is controlled with QCP::iSelectLegend. If this is set, the user may select the legend itself or individual items by clicking on them. What parts exactly are selectable can be controlled via QCPLegend::setSelectableParts. To find out whether the legend or any of its child items are selected, check the value of QCPLegend::selectedParts. To find out which child items are selected, call QCPLegend::selectedItems.
All other selectable elements The selection of all other selectable objects (e.g. QCPPlotTitle, or your own layerable subclasses) is controlled with QCP::iSelectOther. If set, the user may select those objects by clicking on them. To find out which are currently selected, you need to check their selected state explicitly.
If the selection state has changed by user interaction, the selectionChangedByUser signal is emitted. Each selectable object additionally emits an individual selectionChanged signal whenever their selection state has changed, i.e. not only by user interaction.
To allow multiple objects to be selected by holding the selection modifier (setMultiSelectModifier), set the flag QCP::iMultiSelect.
Definition at line 13623 of file qcustomplot.cpp.
References interactions(), and mInteractions.
Referenced by AnglesCustomPlot::createQCPBars(), cvProbeFilter::createUi(), and WolmanCustomPlot::WolmanCustomPlot().
| void QCustomPlot::setInteractions | ( | const QCP::Interactions & | interactions | ) |
| void QCustomPlot::setMultiSelectModifier | ( | Qt::KeyboardModifier | modifier | ) |
Sets the keyboard modifier that will be recognized as multi-select-modifier.
If QCP::iMultiSelect is specified in setInteractions, the user may select multiple objects (or data points) by clicking on them one after the other while holding down modifier.
By default the multi-select-modifier is set to Qt::ControlModifier.
Sets the keyboard modifier that will be recognized as multi-select-modifier.
If QCP::iMultiSelect is specified in setInteractions, the user may select multiple objects by clicking on them one after the other while holding down modifier.
By default the multi-select-modifier is set to Qt::ControlModifier.
Definition at line 13710 of file qcustomplot.cpp.
References mMultiSelectModifier.
| void QCustomPlot::setMultiSelectModifier | ( | Qt::KeyboardModifier | modifier | ) |
| void QCustomPlot::setNoAntialiasingOnDrag | ( | bool | enabled | ) |
Sets whether antialiasing is disabled for this QCustomPlot while the user is dragging axes ranges. If many objects, especially plottables, are drawn antialiased, this greatly improves performance during dragging. Thus it creates a more responsive user experience. As soon as the user stops dragging, the last replot is done with normal antialiasing, to restore high image quality.
Definition at line 13670 of file qcustomplot.cpp.
References mNoAntialiasingOnDrag.
| void QCustomPlot::setNoAntialiasingOnDrag | ( | bool | enabled | ) |
| void QCustomPlot::setNotAntialiasedElement | ( | QCP::AntialiasedElement | notAntialiasedElement, |
| bool | enabled = true |
||
| ) |
Sets whether the specified notAntialiasedElement is forcibly drawn not antialiased.
See setNotAntialiasedElements for details.
Definition at line 13536 of file qcustomplot.cpp.
References mAntialiasedElements, and mNotAntialiasedElements.
| void QCustomPlot::setNotAntialiasedElement | ( | QCP::AntialiasedElement | notAntialiasedElement, |
| bool | enabled = true |
||
| ) |
| void QCustomPlot::setNotAntialiasedElements | ( | const QCP::AntialiasedElements & | notAntialiasedElements | ) |
Sets which elements are forcibly drawn not antialiased as an or combination of QCP::AntialiasedElement.
This overrides the antialiasing settings for whole element groups, normally controlled with the setAntialiasing function on the individual elements. If an element is neither specified in setAntialiasedElements nor in setNotAntialiasedElements, the antialiasing setting on each individual element instance is used.
For example, if notAntialiasedElements contains QCP::aePlottables, no plottables will be drawn antialiased, no matter what the specific QCPAbstractPlottable::setAntialiased value was set to.
if an element in notAntialiasedElements is already set in setAntialiasedElements, it is removed from there.
Definition at line 13518 of file qcustomplot.cpp.
References mAntialiasedElements, mNotAntialiasedElements, and notAntialiasedElements().
Referenced by QCPAxis::mouseMoveEvent(), QCPAxisRect::mouseMoveEvent(), QCPAxis::mouseReleaseEvent(), and QCPAxisRect::mouseReleaseEvent().
| void QCustomPlot::setNotAntialiasedElements | ( | const QCP::AntialiasedElements & | notAntialiasedElements | ) |
| void QCustomPlot::setOpenGl | ( | bool | enabled, |
| int | multisampling = 16 |
||
| ) |
This method allows to enable OpenGL plot rendering, for increased plotting performance of graphically demanding plots (thick lines, translucent fills, etc.).
If enabled is set to true, QCustomPlot will try to initialize OpenGL and, if successful, continue plotting with hardware acceleration. The parameter multisampling controls how many samples will be used per pixel, it essentially controls the antialiasing quality. If multisampling is set too high for the current graphics hardware, the maximum allowed value will be used.
You can test whether switching to OpenGL rendering was successful by checking whether the according getter QCustomPlot::openGl() returns true. If the OpenGL initialization fails, rendering continues with the regular software rasterizer, and an according qDebug output is generated.
If switching to OpenGL was successful, this method disables label caching (setPlottingHint(QCP::phCacheLabels, false)) and turns on QCustomPlot's antialiasing override for all elements (setAntialiasedElements(QCP::aeAll)), leading to a higher quality output. The antialiasing override allows for pixel-grid aligned drawing in the OpenGL paint device. As stated before, in OpenGL rendering the actual antialiasing of the plot is controlled with multisampling. If enabled is set to false, the antialiasing/label caching settings are restored to what they were before OpenGL was enabled, if they weren't altered in the meantime.
QCUSTOMPLOT_USE_OPENGL defined. This define must be set before including the QCustomPlot header both during compilation of the QCustomPlot library as well as when compiling your application. It is best to just include the line DEFINES += QCUSTOMPLOT_USE_OPENGL in the respective qmake project files. QT variable in the qmake project files. For Qt versions 5.0 and higher, QCustomPlot switches to a newer OpenGL interface which is already in the "gui" module. Definition at line 13836 of file qcustomplot.cpp.
References QCP::aeAll, freeOpenGl(), mAntialiasedElements, mOpenGl, mOpenGlAntialiasedElementsBackup, mOpenGlCacheLabelsBackup, mOpenGlMultisamples, mPaintBuffers, mPlottingHints, QCP::phCacheLabels, setAntialiasedElements(), setPlottingHint(), setupOpenGl(), and setupPaintBuffers().
| void QCustomPlot::setPlottingHint | ( | QCP::PlottingHint | hint, |
| bool | enabled = true |
||
| ) |
Sets the specified plotting hint to enabled.
Definition at line 13689 of file qcustomplot.cpp.
References mPlottingHints, and setPlottingHints().
Referenced by setOpenGl().
| void QCustomPlot::setPlottingHint | ( | QCP::PlottingHint | hint, |
| bool | enabled = true |
||
| ) |
| void QCustomPlot::setPlottingHints | ( | const QCP::PlottingHints & | hints | ) |
Sets the plotting hints for this QCustomPlot instance as an or combination of QCP::PlottingHint.
Definition at line 13680 of file qcustomplot.cpp.
References mPlottingHints.
Referenced by setPlottingHint().
| void QCustomPlot::setPlottingHints | ( | const QCP::PlottingHints & | hints | ) |
| void QCustomPlot::setSelectionRect | ( | QCPSelectionRect * | selectionRect | ) |
Sets the QCPSelectionRect instance that QCustomPlot will use if mode is not QCP::srmNone and the user performs a click-and-drag interaction. QCustomPlot takes ownership of the passed selectionRect. It can be accessed later via selectionRect.
This method is useful if you wish to replace the default QCPSelectionRect instance with an instance of a QCPSelectionRect subclass, to introduce custom behaviour of the selection rect.
Definition at line 13778 of file qcustomplot.cpp.
References mSelectionRect, mSelectionRectMode, processRectSelection(), processRectZoom(), selectionRect(), QCP::srmSelect, and QCP::srmZoom.
| void QCustomPlot::setSelectionRectMode | ( | QCP::SelectionRectMode | mode | ) |
Sets how QCustomPlot processes mouse click-and-drag interactions by the user.
If mode is QCP::srmNone, the mouse drag is forwarded to the underlying objects. For example, QCPAxisRect may process a mouse drag by dragging axis ranges, see QCPAxisRect::setRangeDrag. If mode is not QCP::srmNone, the current selection rect (selectionRect) becomes activated and allows e.g. rect zooming and data point selection.
If you wish to provide your user both with axis range dragging and data selection/range zooming, use this method to switch between the modes just before the interaction is processed, e.g. in reaction to the mousePress or mouseMove signals. For example you could check whether the user is holding a certain keyboard modifier, and then decide which mode shall be set.
If a selection rect interaction is currently active, and mode is set to QCP::srmNone, the interaction is canceled (QCPSelectionRect::cancel). Switching between any of the other modes will keep the selection rect active. Upon completion of the interaction, the behaviour is as defined by the currently set mode, not the mode that was set when the interaction started.
Definition at line 13739 of file qcustomplot.cpp.
References QCPSelectionRect::cancel(), mSelectionRect, mSelectionRectMode, processRectSelection(), processRectZoom(), QCP::srmNone, QCP::srmSelect, and QCP::srmZoom.
| void QCustomPlot::setSelectionTolerance | ( | int | pixels | ) |
Sets the tolerance that is used to decide whether a click selects an object (e.g. a plottable) or not.
If the user clicks in the vicinity of the line of e.g. a QCPGraph, it's only regarded as a potential selection when the minimum distance between the click position and the graph line is smaller than pixels. Objects that are defined by an area (e.g. QCPBars) only react to clicks directly inside the area and ignore this selection tolerance. In other words, it only has meaning for parts of objects that are too thin to exactly hit with a click and thus need such a tolerance.
Definition at line 13656 of file qcustomplot.cpp.
References mSelectionTolerance.
| void QCustomPlot::setSelectionTolerance | ( | int | pixels | ) |
|
protected |
Definition at line 15780 of file qcustomplot.cpp.
References freeOpenGl(), and mOpenGlMultisamples.
Referenced by setOpenGl().
|
protected |
Definition at line 15673 of file qcustomplot.cpp.
References createPaintBuffer(), layer(), QCPLayer::lmBuffered, QCPLayer::lmLogical, mLayers, QCPLayer::mode(), QCPLayer::mPaintBuffer, mPaintBuffers, size, and viewport().
Referenced by addLayer(), replot(), and setOpenGl().
| void QCustomPlot::setViewport | ( | const QRect & | rect | ) |
Sets the viewport of this QCustomPlot. Usually users of QCustomPlot don't need to change the viewport manually.
The viewport is the area in which the plot is drawn. All mechanisms, e.g. margin caluclation take the viewport to be the outer border of the plot. The viewport normally is the rect() of the QCustomPlot widget, i.e. a rect with top left (0, 0) and size of the QCustomPlot widget.
Don't confuse the viewport with the axis rect (QCustomPlot::axisRect). An axis rect is typically an area enclosed by four axes, where the graphs/plottables are drawn in. The viewport is larger and contains also the axes themselves, their tick numbers, their labels, or even additional axis rects, color scales and other layout elements.
This function is used to allow arbitrary size exports with toPixmap, savePng, savePdf, etc. by temporarily changing the viewport size.
Sets the viewport of this QCustomPlot. The Viewport is the area that the top level layout (QCustomPlot::plotLayout()) uses as its rect. Normally, the viewport is the entire widget rect.
This function is used to allow arbitrary size exports with toPixmap, savePng, savePdf, etc. by temporarily changing the viewport size.
Definition at line 13897 of file qcustomplot.cpp.
References mPlotLayout, mViewport, and QCPLayoutElement::setOuterRect().
Referenced by QCustomPlot(), resizeEvent(), savePdf(), toPainter(), and toPixmap().
| void QCustomPlot::setViewport | ( | const QRect & | rect | ) |
|
protectedvirtual |
Definition at line 15267 of file qcustomplot.cpp.
References QCPLayoutGrid::minimumOuterSizeHint(), and mPlotLayout.
|
protectedvirtual |
|
signal |
This signal is emitted when a plot title is clicked.
event is the mouse event that caused the click and title is the plot title that received the click.
|
signal |
This signal is emitted when a plot title is double clicked.
event is the mouse event that caused the click and title is the plot title that received the click.
| void QCustomPlot::toPainter | ( | QCPPainter * | painter, |
| int | width = 0, |
||
| int | height = 0 |
||
| ) |
Renders the plot using the passed painter.
The plot is sized to width and height in pixels. If the painter's scale is not 1.0, the resulting plot will appear scaled accordingly.
Definition at line 16368 of file qcustomplot.cpp.
References draw(), height, mBackgroundBrush, mViewport, QCPPainter::pmNoCaching, QCPPainter::setMode(), setViewport(), viewport(), and width.
| void QCustomPlot::toPainter | ( | QCPPainter * | painter, |
| int | width = 0, |
||
| int | height = 0 |
||
| ) |
| QPixmap QCustomPlot::toPixmap | ( | int | width = 0, |
| int | height = 0, |
||
| double | scale = 1.0 |
||
| ) |
Renders the plot to a pixmap and returns it.
The plot is sized to width and height in pixels and scaled with scale. (width 100 and scale 2.0 lead to a full resolution pixmap with width 200.)
Definition at line 16305 of file qcustomplot.cpp.
References QCPPainter::begin(), draw(), height, mBackgroundBrush, mViewport, QCPPainter::pmNoCaching, QCPPainter::pmNonCosmetic, result, QCPPainter::setMode(), setViewport(), viewport(), and width.
Referenced by saveRastered().
| QPixmap QCustomPlot::toPixmap | ( | int | width = 0, |
| int | height = 0, |
||
| double | scale = 1.0 |
||
| ) |
|
protected |
Definition at line 16159 of file qcustomplot.cpp.
References mLayers.
Referenced by addLayer(), moveLayer(), QCustomPlot(), and removeLayer().
|
protected |
|
protectedvirtual |
Definition at line 15601 of file qcustomplot.cpp.
References mPlotLayout, QCPLayout::update(), QCPLayoutElement::upLayout, QCPLayoutElement::upMargins, and QCPLayoutElement::upPreparation.
|
inline |
Returns the viewport rect of this QCustomPlot instance. The viewport is the area the plot is drawn in, all mechanisms, e.g. margin caluclation take the viewport to be the outer border of the plot. The viewport normally is the rect() of the QCustomPlot widget, i.e. a rect with top left (0, 0) and size of the QCustomPlot widget.
Don't confuse the viewport with the axis rect (QCustomPlot::axisRect). An axis rect is typically an area enclosed by four axes, where the graphs/plottables are drawn in. The viewport is larger and contains also the axes themselves, their tick numbers, their labels, the plot title etc.
Only when saving to a file (see savePng, savePdf etc.) the viewport is temporarily modified to allow saving plots with sizes independent of the current widget size.
Definition at line 4232 of file qcustomplot.h.
Referenced by QCPAxis::calculateMargin(), QCPLayerable::clipRect(), QCPAbstractItem::clipRect(), createPaintBuffer(), QCPAxis::draw(), QCPItemPosition::pixelPoint(), QCPItemPosition::pixelPosition(), savePdf(), QCPItemPosition::setPixelPoint(), QCPItemPosition::setPixelPosition(), setupPaintBuffers(), toPainter(), and toPixmap().
|
inline |
Definition at line 2075 of file qcustomplot.h.
|
protectedvirtual |
Reimplemented in ccHistogramWindow.
Definition at line 15538 of file qcustomplot.cpp.
References event, layerableListAt(), mouseWheel(), and QCPLayerable::wheelEvent().
|
protectedvirtual |
Reimplemented in ccHistogramWindow.
| QCPLegend * QCustomPlot::legend |
A pointer to the default legend of the main axis rect. The legend is invisible by default. Use QCPLegend::setVisible to change this.
QCustomPlot offers convenient pointers to the axes (xAxis, yAxis, xAxis2, yAxis2) and the legend. They make it very easy working with plots that only have a single axis rect and at most one axis at each axis rect side. If you use the layout system to add multiple legends to the plot, use the layout system interface to access the new legend. For example, legends can be placed inside an axis rect's inset layout, and must then also be accessed via the inset layout. If the default legend is removed due to manipulation of the layout system (e.g. by removing the main axis rect), the corresponding pointer becomes 0.
If an axis convenience pointer is currently zero and a new axis rect or a corresponding axis is added in the place of the main axis rect, QCustomPlot resets the convenience pointers to the according new axes. Similarly the legend convenience pointer will be reset if a legend is added after the main legend was removed before.
A pointer to the default legend of the main axis rect. The legend is invisible by default. Use QCPLegend::setVisible to change this.
QCustomPlot offers convenient pointers to the axes (xAxis, yAxis, xAxis2, yAxis2) and the legend. They make it very easy working with plots that only have a single axis rect and at most one axis at each axis rect side. If you use the layout system to add multiple legends to the plot, use the layout system interface to access the new legend. For example, legends can be placed inside an axis rect's inset layout, and must then also be accessed via the inset layout. If the default legend is removed due to manipulation of the layout system (e.g. by removing the main axis rect), the corresponding pointer becomes 0.
Definition at line 4394 of file qcustomplot.h.
Referenced by QCPAbstractPlottable::addToLegend(), cvProbeFilter::createUi(), legendRemoved(), QCPLegend::parentPlotInitialized(), QCustomPlot(), and QCPAbstractPlottable::removeFromLegend().
|
protected |
Definition at line 4439 of file qcustomplot.h.
Referenced by QCustomPlot(), setAntialiasedElement(), setAntialiasedElements(), setNotAntialiasedElement(), setNotAntialiasedElements(), and setOpenGl().
|
protected |
Definition at line 4433 of file qcustomplot.h.
Referenced by addPlottable(), registerPlottable(), and setAutoAddPlottableToLegend().
|
protected |
Definition at line 4443 of file qcustomplot.h.
Referenced by paintEvent(), savePdf(), setBackground(), toPainter(), and toPixmap().
|
protected |
Definition at line 4444 of file qcustomplot.h.
Referenced by drawBackground(), and setBackground().
|
protected |
Definition at line 4446 of file qcustomplot.h.
Referenced by drawBackground(), setBackground(), and setBackgroundScaled().
|
protected |
Definition at line 4447 of file qcustomplot.h.
Referenced by drawBackground(), setBackground(), and setBackgroundScaledMode().
|
protected |
Definition at line 4431 of file qcustomplot.h.
Referenced by createPaintBuffer(), and setBufferDevicePixelRatio().
|
protected |
Definition at line 4448 of file qcustomplot.h.
Referenced by currentLayer(), removeLayer(), setCurrentLayer(), and ~QCustomPlot().
|
protected |
Definition at line 4435 of file qcustomplot.h.
Referenced by addGraph(), addPlottable(), clearGraphs(), graph(), graphCount(), QCPAxis::graphs(), QCPAxisRect::graphs(), registerGraph(), removeGraph(), removePlottable(), and selectedGraphs().
|
protected |
Definition at line 4440 of file qcustomplot.h.
Referenced by processPointSelection(), processRectSelection(), setInteraction(), and setInteractions().
|
protected |
Definition at line 4437 of file qcustomplot.h.
Referenced by addItem(), clearItems(), hasItem(), item(), itemAt(), itemCount(), QCPAxis::items(), QCPAxisRect::items(), registerItem(), removeItem(), and selectedItems().
|
protected |
Definition at line 4438 of file qcustomplot.h.
Referenced by addLayer(), deselectAll(), draw(), layer(), layerableListAt(), layerCount(), moveLayer(), processPointSelection(), processRectSelection(), QCustomPlot(), removeLayer(), replot(), setCurrentLayer(), setupPaintBuffers(), updateLayerIndices(), and ~QCustomPlot().
|
protected |
Definition at line 2282 of file qcustomplot.h.
|
protected |
Definition at line 4459 of file qcustomplot.h.
Referenced by mouseDoubleClickEvent(), mouseMoveEvent(), mousePressEvent(), and mouseReleaseEvent().
|
protected |
Definition at line 4461 of file qcustomplot.h.
Referenced by mouseDoubleClickEvent(), and mousePressEvent().
|
protected |
Definition at line 4458 of file qcustomplot.h.
Referenced by mouseDoubleClickEvent(), mouseMoveEvent(), mousePressEvent(), and mouseReleaseEvent().
|
protected |
Definition at line 4457 of file qcustomplot.h.
Referenced by mouseDoubleClickEvent(), mouseMoveEvent(), mousePressEvent(), and mouseReleaseEvent().
|
protected |
Definition at line 4460 of file qcustomplot.h.
Referenced by mousePressEvent(), and mouseReleaseEvent().
|
protected |
Definition at line 4462 of file qcustomplot.h.
Referenced by mousePressEvent(), and mouseReleaseEvent().
|
protected |
Definition at line 4450 of file qcustomplot.h.
Referenced by processPointSelection(), processRectSelection(), and setMultiSelectModifier().
|
protected |
Definition at line 4442 of file qcustomplot.h.
Referenced by setNoAntialiasingOnDrag().
|
protected |
Definition at line 4439 of file qcustomplot.h.
Referenced by setAntialiasedElement(), setAntialiasedElements(), setNotAntialiasedElement(), and setNotAntialiasedElements().
|
protected |
Definition at line 4453 of file qcustomplot.h.
Referenced by createPaintBuffer(), and setOpenGl().
|
protected |
Definition at line 4466 of file qcustomplot.h.
Referenced by QCustomPlot(), and setOpenGl().
|
protected |
Definition at line 4467 of file qcustomplot.h.
Referenced by QCustomPlot(), and setOpenGl().
|
protected |
Definition at line 4465 of file qcustomplot.h.
Referenced by createPaintBuffer(), setOpenGl(), and setupOpenGl().
|
protected |
Definition at line 2280 of file qcustomplot.h.
|
protected |
Definition at line 4456 of file qcustomplot.h.
Referenced by hasInvalidatedPaintBuffers(), paintEvent(), replot(), setBufferDevicePixelRatio(), setOpenGl(), and setupPaintBuffers().
|
protected |
Definition at line 4432 of file qcustomplot.h.
Referenced by axisRectAt(), axisRects(), layoutElementAt(), minimumSizeHint(), QCustomPlot(), selectedLegends(), setViewport(), sizeHint(), updateLayout(), and ~QCustomPlot().
|
protected |
Definition at line 4434 of file qcustomplot.h.
Referenced by addPlottable(), clearPlottables(), hasPlottable(), plottable(), plottableAt(), plottableCount(), QCPAxis::plottables(), QCPAxisRect::plottables(), registerPlottable(), removePlottable(), and selectedPlottables().
|
protected |
Definition at line 4449 of file qcustomplot.h.
Referenced by QCustomPlot(), replot(), setOpenGl(), setPlottingHint(), and setPlottingHints().
|
protected |
Definition at line 4464 of file qcustomplot.h.
Referenced by replot().
|
protected |
Definition at line 4463 of file qcustomplot.h.
Referenced by replot().
|
protected |
Definition at line 4445 of file qcustomplot.h.
Referenced by drawBackground(), and setBackground().
|
protected |
Definition at line 4452 of file qcustomplot.h.
Referenced by mouseMoveEvent(), mousePressEvent(), mouseReleaseEvent(), processRectSelection(), QCustomPlot(), setSelectionRect(), and setSelectionRectMode().
|
protected |
Definition at line 4451 of file qcustomplot.h.
Referenced by mousePressEvent(), setSelectionRect(), and setSelectionRectMode().
|
protected |
Definition at line 4441 of file qcustomplot.h.
Referenced by itemAt(), plottableAt(), and setSelectionTolerance().
|
protected |
Definition at line 4430 of file qcustomplot.h.
Referenced by drawBackground(), paintEvent(), savePdf(), setViewport(), toPainter(), and toPixmap().
| QCPAxis * QCustomPlot::xAxis |
A pointer to the primary x Axis (bottom) of the main axis rect of the plot.
QCustomPlot offers convenient pointers to the axes (xAxis, yAxis, xAxis2, yAxis2) and the legend. They make it very easy working with plots that only have a single axis rect and at most one axis at each axis rect side. If you use the layout system to add multiple axis rects or multiple axes to one side, use the QCPAxisRect::axis interface to access the new axes. If one of the four default axes or the default legend is removed due to manipulation of the layout system (e.g. by removing the main axis rect), the corresponding pointers become 0.
If an axis convenience pointer is currently zero and a new axis rect or a corresponding axis is added in the place of the main axis rect, QCustomPlot resets the convenience pointers to the according new axes. Similarly the legend convenience pointer will be reset if a legend is added after the main legend was removed before.
A pointer to the primary x Axis (bottom) of the main axis rect of the plot.
QCustomPlot offers convenient pointers to the axes (xAxis, yAxis, xAxis2, yAxis2) and the legend. They make it very easy working with plots that only have a single axis rect and at most one axis at each axis rect side. If you use the layout system to add multiple axis rects or multiple axes to one side, use the QCPAxisRect::axis interface to access the new axes. If one of the four default axes or the default legend is removed due to manipulation of the layout system (e.g. by removing the main axis rect), the corresponding pointers become 0.
Definition at line 4393 of file qcustomplot.h.
Referenced by QCPAxisRect::addAxis(), addGraph(), axisRemoved(), ccHistogramWindow::ccHistogramWindow(), ccWaveWidget::ccWaveWidget(), QCPAbstractItem::createPosition(), AnglesCustomPlot::createQCPBars(), cvProbeFilter::createUi(), QCPAxisRect::layoutChanged(), QCustomPlot(), ccHistogramWindow::refresh(), ccWaveWidget::refresh(), ccHistogramWindow::setAxisLabels(), ccWaveWidget::setAxisLabels(), sfEditDlg::sfEditDlg(), and WolmanCustomPlot::WolmanCustomPlot().
| QCPAxis * QCustomPlot::xAxis2 |
A pointer to the secondary x Axis (top) of the main axis rect of the plot. Secondary axes are invisible by default. Use QCPAxis::setVisible to change this (or use QCPAxisRect::setupFullAxesBox).
QCustomPlot offers convenient pointers to the axes (xAxis, yAxis, xAxis2, yAxis2) and the legend. They make it very easy working with plots that only have a single axis rect and at most one axis at each axis rect side. If you use the layout system to add multiple axis rects or multiple axes to one side, use the QCPAxisRect::axis interface to access the new axes. If one of the four default axes or the default legend is removed due to manipulation of the layout system (e.g. by removing the main axis rect), the corresponding pointers become 0.
If an axis convenience pointer is currently zero and a new axis rect or a corresponding axis is added in the place of the main axis rect, QCustomPlot resets the convenience pointers to the according new axes. Similarly the legend convenience pointer will be reset if a legend is added after the main legend was removed before.
A pointer to the secondary x Axis (top) of the main axis rect of the plot. Secondary axes are invisible by default. Use QCPAxis::setVisible to change this (or use QCPAxisRect::setupFullAxesBox).
QCustomPlot offers convenient pointers to the axes (xAxis, yAxis, xAxis2, yAxis2) and the legend. They make it very easy working with plots that only have a single axis rect and at most one axis at each axis rect side. If you use the layout system to add multiple axis rects or multiple axes to one side, use the QCPAxisRect::axis interface to access the new axes. If one of the four default axes or the default legend is removed due to manipulation of the layout system (e.g. by removing the main axis rect), the corresponding pointers become 0.
Definition at line 4393 of file qcustomplot.h.
Referenced by QCPAxisRect::addAxis(), axisRemoved(), cvProbeFilter::createUi(), QCPAxisRect::layoutChanged(), and QCustomPlot().
| QCPAxis * QCustomPlot::yAxis |
A pointer to the primary y Axis (left) of the main axis rect of the plot.
QCustomPlot offers convenient pointers to the axes (xAxis, yAxis, xAxis2, yAxis2) and the legend. They make it very easy working with plots that only have a single axis rect and at most one axis at each axis rect side. If you use the layout system to add multiple axis rects or multiple axes to one side, use the QCPAxisRect::axis interface to access the new axes. If one of the four default axes or the default legend is removed due to manipulation of the layout system (e.g. by removing the main axis rect), the corresponding pointers become 0.
If an axis convenience pointer is currently zero and a new axis rect or a corresponding axis is added in the place of the main axis rect, QCustomPlot resets the convenience pointers to the according new axes. Similarly the legend convenience pointer will be reset if a legend is added after the main legend was removed before.
A pointer to the primary y Axis (left) of the main axis rect of the plot.
QCustomPlot offers convenient pointers to the axes (xAxis, yAxis, xAxis2, yAxis2) and the legend. They make it very easy working with plots that only have a single axis rect and at most one axis at each axis rect side. If you use the layout system to add multiple axis rects or multiple axes to one side, use the QCPAxisRect::axis interface to access the new axes. If one of the four default axes or the default legend is removed due to manipulation of the layout system (e.g. by removing the main axis rect), the corresponding pointers become 0.
Definition at line 4393 of file qcustomplot.h.
Referenced by QCPAxisRect::addAxis(), addGraph(), axisRemoved(), ccHistogramWindow::ccHistogramWindow(), ccWaveWidget::ccWaveWidget(), QCPAbstractItem::createPosition(), AnglesCustomPlot::createQCPBars(), cvProbeFilter::createUi(), QCPAxisRect::layoutChanged(), QCustomPlot(), ccHistogramWindow::refresh(), ccWaveWidget::refresh(), ccHistogramWindow::setAxisLabels(), ccWaveWidget::setAxisLabels(), sfEditDlg::sfEditDlg(), and WolmanCustomPlot::WolmanCustomPlot().
| QCPAxis * QCustomPlot::yAxis2 |
A pointer to the secondary y Axis (right) of the main axis rect of the plot. Secondary axes are invisible by default. Use QCPAxis::setVisible to change this (or use QCPAxisRect::setupFullAxesBox).
QCustomPlot offers convenient pointers to the axes (xAxis, yAxis, xAxis2, yAxis2) and the legend. They make it very easy working with plots that only have a single axis rect and at most one axis at each axis rect side. If you use the layout system to add multiple axis rects or multiple axes to one side, use the QCPAxisRect::axis interface to access the new axes. If one of the four default axes or the default legend is removed due to manipulation of the layout system (e.g. by removing the main axis rect), the corresponding pointers become 0.
If an axis convenience pointer is currently zero and a new axis rect or a corresponding axis is added in the place of the main axis rect, QCustomPlot resets the convenience pointers to the according new axes. Similarly the legend convenience pointer will be reset if a legend is added after the main legend was removed before.
A pointer to the secondary y Axis (right) of the main axis rect of the plot. Secondary axes are invisible by default. Use QCPAxis::setVisible to change this (or use QCPAxisRect::setupFullAxesBox).
QCustomPlot offers convenient pointers to the axes (xAxis, yAxis, xAxis2, yAxis2) and the legend. They make it very easy working with plots that only have a single axis rect and at most one axis at each axis rect side. If you use the layout system to add multiple axis rects or multiple axes to one side, use the QCPAxisRect::axis interface to access the new axes. If one of the four default axes or the default legend is removed due to manipulation of the layout system (e.g. by removing the main axis rect), the corresponding pointers become 0.
Definition at line 4393 of file qcustomplot.h.
Referenced by QCPAxisRect::addAxis(), axisRemoved(), cvProbeFilter::createUi(), QCPAxisRect::layoutChanged(), and QCustomPlot().