|
ACloudViewer
3.9.4
A Modern Library for 3D Data Processing
|
|
ACloudViewer
3.9.4
A Modern Library for 3D Data Processing
|
A plottable representing a parametric curve in a plot. More...
#include <qcustomplot.h>
Public Types | |
| enum | LineStyle { lsNone , lsLine , lsNone , lsLine } |
| enum | LineStyle { lsNone , lsLine , lsNone , lsLine } |
Public Member Functions | |
| QCPCurve (QCPAxis *keyAxis, QCPAxis *valueAxis) | |
| virtual | ~QCPCurve () |
| QSharedPointer< QCPCurveDataContainer > | data () const |
| QCPScatterStyle | scatterStyle () const |
| int | scatterSkip () const |
| LineStyle | lineStyle () const |
| void | setData (QSharedPointer< QCPCurveDataContainer > data) |
| void | setData (const QVector< double > &t, const QVector< double > &keys, const QVector< double > &values, bool alreadySorted=false) |
| void | setData (const QVector< double > &keys, const QVector< double > &values) |
| void | setScatterStyle (const QCPScatterStyle &style) |
| void | setScatterSkip (int skip) |
| void | setLineStyle (LineStyle style) |
| void | addData (const QVector< double > &t, const QVector< double > &keys, const QVector< double > &values, bool alreadySorted=false) |
| void | addData (const QVector< double > &keys, const QVector< double > &values) |
| void | addData (double t, double key, double value) |
| void | addData (double key, double value) |
| virtual double | selectTest (const QPointF &pos, bool onlySelectable, QVariant *details=0) const |
| virtual QCPRange | getKeyRange (bool &foundRange, QCP::SignDomain inSignDomain=QCP::sdBoth) const |
| virtual QCPRange | getValueRange (bool &foundRange, QCP::SignDomain inSignDomain=QCP::sdBoth, const QCPRange &inKeyRange=QCPRange()) const |
| QCPCurve (QCPAxis *keyAxis, QCPAxis *valueAxis) | |
| virtual | ~QCPCurve () |
| QCPCurveDataMap * | data () const |
| QCPScatterStyle | scatterStyle () const |
| LineStyle | lineStyle () const |
| void | setData (QCPCurveDataMap *data, bool copy=false) |
| void | setData (const QVector< double > &t, const QVector< double > &key, const QVector< double > &value) |
| void | setData (const QVector< double > &key, const QVector< double > &value) |
| void | setScatterStyle (const QCPScatterStyle &style) |
| void | setLineStyle (LineStyle style) |
| void | addData (const QCPCurveDataMap &dataMap) |
| void | addData (const QCPCurveData &data) |
| void | addData (double t, double key, double value) |
| void | addData (double key, double value) |
| void | addData (const QVector< double > &ts, const QVector< double > &keys, const QVector< double > &values) |
| void | removeDataBefore (double t) |
| void | removeDataAfter (double t) |
| void | removeData (double fromt, double tot) |
| void | removeData (double t) |
| virtual void | clearData () |
| virtual double | selectTest (const QPointF &pos, bool onlySelectable, QVariant *details=0) const |
 Public Member Functions inherited from QCPAbstractPlottable1D< QCPCurveData > Public Member Functions inherited from QCPAbstractPlottable1D< QCPCurveData > | |
| QCPAbstractPlottable1D (QCPAxis *keyAxis, QCPAxis *valueAxis) | |
| virtual | ~QCPAbstractPlottable1D () |
| virtual int | dataCount () const |
| virtual double | dataMainKey (int index) const |
| virtual double | dataSortKey (int index) const |
| virtual double | dataMainValue (int index) const |
| virtual QCPRange | dataValueRange (int index) const |
| virtual QPointF | dataPixelPosition (int index) const |
| virtual bool | sortKeyIsMainKey () const |
| virtual QCPDataSelection | selectTestRect (const QRectF &rect, bool onlySelectable) const |
| virtual int | findBegin (double sortKey, bool expandedRange=true) const |
| virtual int | findEnd (double sortKey, bool expandedRange=true) const |
| virtual QCPPlottableInterface1D * | interface1D () |
| Public Member Functions inherited from QCPAbstractPlottable | |
| QCPAbstractPlottable (QCPAxis *keyAxis, QCPAxis *valueAxis) | |
| virtual | ~QCPAbstractPlottable () |
| QString | name () const |
| bool | antialiasedFill () const |
| bool | antialiasedScatters () const |
| QPen | pen () const |
| QBrush | brush () const |
| QCPAxis * | keyAxis () const |
| QCPAxis * | valueAxis () const |
| QCP::SelectionType | selectable () const |
| bool | selected () const |
| QCPDataSelection | selection () const |
| QCPSelectionDecorator * | selectionDecorator () const |
| void | setName (const QString &name) |
| void | setAntialiasedFill (bool enabled) |
| void | setAntialiasedScatters (bool enabled) |
| void | setPen (const QPen &pen) |
| void | setBrush (const QBrush &brush) |
| void | setKeyAxis (QCPAxis *axis) |
| void | setValueAxis (QCPAxis *axis) |
| Q_SLOT void | setSelectable (QCP::SelectionType selectable) |
| Q_SLOT void | setSelection (QCPDataSelection selection) |
| void | setSelectionDecorator (QCPSelectionDecorator *decorator) |
| void | coordsToPixels (double key, double value, double &x, double &y) const |
| const QPointF | coordsToPixels (double key, double value) const |
| void | pixelsToCoords (double x, double y, double &key, double &value) const |
| void | pixelsToCoords (const QPointF &pixelPos, double &key, double &value) const |
| void | rescaleAxes (bool onlyEnlarge=false) const |
| void | rescaleKeyAxis (bool onlyEnlarge=false) const |
| void | rescaleValueAxis (bool onlyEnlarge=false, bool inKeyRange=false) const |
| bool | addToLegend (QCPLegend *legend) |
| bool | addToLegend () |
| bool | removeFromLegend (QCPLegend *legend) const |
| bool | removeFromLegend () const |
| QCPAbstractPlottable (QCPAxis *keyAxis, QCPAxis *valueAxis) | |
| QString | name () const |
| bool | antialiasedFill () const |
| bool | antialiasedScatters () const |
| bool | antialiasedErrorBars () const |
| QPen | pen () const |
| QPen | selectedPen () const |
| QBrush | brush () const |
| QBrush | selectedBrush () const |
| QCPAxis * | keyAxis () const |
| QCPAxis * | valueAxis () const |
| bool | selectable () const |
| bool | selected () const |
| void | setName (const QString &name) |
| void | setAntialiasedFill (bool enabled) |
| void | setAntialiasedScatters (bool enabled) |
| void | setAntialiasedErrorBars (bool enabled) |
| void | setPen (const QPen &pen) |
| void | setSelectedPen (const QPen &pen) |
| void | setBrush (const QBrush &brush) |
| void | setSelectedBrush (const QBrush &brush) |
| void | setKeyAxis (QCPAxis *axis) |
| void | setValueAxis (QCPAxis *axis) |
| Q_SLOT void | setSelectable (bool selectable) |
| Q_SLOT void | setSelected (bool selected) |
| virtual bool | addToLegend () |
| virtual bool | removeFromLegend () const |
| void | rescaleAxes (bool onlyEnlarge=false) const |
| void | rescaleKeyAxis (bool onlyEnlarge=false) const |
| void | rescaleValueAxis (bool onlyEnlarge=false) const |
| Public Member Functions inherited from QCPLayerable | |
| QCPLayerable (QCustomPlot *plot, QString targetLayer=QString(), QCPLayerable *parentLayerable=0) | |
| virtual | ~QCPLayerable () |
| bool | visible () const |
| QCustomPlot * | parentPlot () const |
| QCPLayerable * | parentLayerable () const |
| QCPLayer * | layer () const |
| bool | antialiased () const |
| void | setVisible (bool on) |
| Q_SLOT bool | setLayer (QCPLayer *layer) |
| bool | setLayer (const QString &layerName) |
| void | setAntialiased (bool enabled) |
| bool | realVisibility () const |
| QCPLayerable (QCustomPlot *plot, QString targetLayer=QString(), QCPLayerable *parentLayerable=0) | |
| ~QCPLayerable () | |
| bool | visible () const |
| QCustomPlot * | parentPlot () const |
| QCPLayerable * | parentLayerable () const |
| QCPLayer * | layer () const |
| bool | antialiased () const |
| void | setVisible (bool on) |
| Q_SLOT bool | setLayer (QCPLayer *layer) |
| bool | setLayer (const QString &layerName) |
| void | setAntialiased (bool enabled) |
| bool | realVisibility () const |
| Public Member Functions inherited from QCPPlottableInterface1D | |
| virtual | ~QCPPlottableInterface1D () |
Protected Member Functions | |
| virtual void | draw (QCPPainter *painter) |
| virtual void | drawLegendIcon (QCPPainter *painter, const QRectF &rect) const |
| virtual void | drawCurveLine (QCPPainter *painter, const QVector< QPointF > &lines) const |
| virtual void | drawScatterPlot (QCPPainter *painter, const QVector< QPointF > &points, const QCPScatterStyle &style) const |
| void | getCurveLines (QVector< QPointF > *lines, const QCPDataRange &dataRange, double penWidth) const |
| void | getScatters (QVector< QPointF > *scatters, const QCPDataRange &dataRange, double scatterWidth) const |
| int | getRegion (double key, double value, double keyMin, double valueMax, double keyMax, double valueMin) const |
| QPointF | getOptimizedPoint (int prevRegion, double prevKey, double prevValue, double key, double value, double keyMin, double valueMax, double keyMax, double valueMin) const |
| QVector< QPointF > | getOptimizedCornerPoints (int prevRegion, int currentRegion, double prevKey, double prevValue, double key, double value, double keyMin, double valueMax, double keyMax, double valueMin) const |
| bool | mayTraverse (int prevRegion, int currentRegion) const |
| bool | getTraverse (double prevKey, double prevValue, double key, double value, double keyMin, double valueMax, double keyMax, double valueMin, QPointF &crossA, QPointF &crossB) const |
| void | getTraverseCornerPoints (int prevRegion, int currentRegion, double keyMin, double valueMax, double keyMax, double valueMin, QVector< QPointF > &beforeTraverse, QVector< QPointF > &afterTraverse) const |
| double | pointDistance (const QPointF &pixelPoint, QCPCurveDataContainer::const_iterator &closestData) const |
| virtual void | draw (QCPPainter *painter) |
| virtual void | drawLegendIcon (QCPPainter *painter, const QRectF &rect) const |
| virtual QCPRange | getKeyRange (bool &foundRange, SignDomain inSignDomain=sdBoth) const |
| virtual QCPRange | getValueRange (bool &foundRange, SignDomain inSignDomain=sdBoth) const |
| virtual void | drawScatterPlot (QCPPainter *painter, const QVector< QPointF > *pointData) const |
| void | getCurveData (QVector< QPointF > *lineData) const |
| int | getRegion (double x, double y, double rectLeft, double rectTop, double rectRight, double rectBottom) const |
| QPointF | getOptimizedPoint (int prevRegion, double prevKey, double prevValue, double key, double value, double rectLeft, double rectTop, double rectRight, double rectBottom) const |
| QVector< QPointF > | getOptimizedCornerPoints (int prevRegion, int currentRegion, double prevKey, double prevValue, double key, double value, double rectLeft, double rectTop, double rectRight, double rectBottom) const |
| bool | mayTraverse (int prevRegion, int currentRegion) const |
| bool | getTraverse (double prevKey, double prevValue, double key, double value, double rectLeft, double rectTop, double rectRight, double rectBottom, QPointF &crossA, QPointF &crossB) const |
| void | getTraverseCornerPoints (int prevRegion, int currentRegion, double rectLeft, double rectTop, double rectRight, double rectBottom, QVector< QPointF > &beforeTraverse, QVector< QPointF > &afterTraverse) const |
| double | pointDistance (const QPointF &pixelPoint) const |
| Protected Member Functions inherited from QCPAbstractPlottable1D< QCPCurveData > | |
| void | getDataSegments (QList< QCPDataRange > &selectedSegments, QList< QCPDataRange > &unselectedSegments) const |
| void | drawPolyline (QCPPainter *painter, const QVector< QPointF > &lineData) const |
| Protected Member Functions inherited from QCPAbstractPlottable | |
| virtual QRect | clipRect () const |
| virtual QCP::Interaction | selectionCategory () const |
| void | applyDefaultAntialiasingHint (QCPPainter *painter) const |
| virtual void | selectEvent (QMouseEvent *event, bool additive, const QVariant &details, bool *selectionStateChanged) |
| virtual void | deselectEvent (bool *selectionStateChanged) |
| void | applyFillAntialiasingHint (QCPPainter *painter) const |
| void | applyScattersAntialiasingHint (QCPPainter *painter) const |
| virtual QRect | clipRect () const |
| virtual QCP::Interaction | selectionCategory () const |
| void | applyDefaultAntialiasingHint (QCPPainter *painter) const |
| virtual void | selectEvent (QMouseEvent *event, bool additive, const QVariant &details, bool *selectionStateChanged) |
| virtual void | deselectEvent (bool *selectionStateChanged) |
| void | coordsToPixels (double key, double value, double &x, double &y) const |
| const QPointF | coordsToPixels (double key, double value) const |
| void | pixelsToCoords (double x, double y, double &key, double &value) const |
| void | pixelsToCoords (const QPointF &pixelPos, double &key, double &value) const |
| QPen | mainPen () const |
| QBrush | mainBrush () const |
| void | applyFillAntialiasingHint (QCPPainter *painter) const |
| void | applyScattersAntialiasingHint (QCPPainter *painter) const |
| void | applyErrorBarsAntialiasingHint (QCPPainter *painter) const |
| double | distSqrToLine (const QPointF &start, const QPointF &end, const QPointF &point) const |
| Protected Member Functions inherited from QCPLayerable | |
| virtual void | parentPlotInitialized (QCustomPlot *parentPlot) |
| virtual void | mousePressEvent (QMouseEvent *event, const QVariant &details) |
| virtual void | mouseMoveEvent (QMouseEvent *event, const QPointF &startPos) |
| virtual void | mouseReleaseEvent (QMouseEvent *event, const QPointF &startPos) |
| virtual void | mouseDoubleClickEvent (QMouseEvent *event, const QVariant &details) |
| virtual void | wheelEvent (QWheelEvent *event) |
| void | initializeParentPlot (QCustomPlot *parentPlot) |
| void | setParentLayerable (QCPLayerable *parentLayerable) |
| bool | moveToLayer (QCPLayer *layer, bool prepend) |
| void | applyAntialiasingHint (QCPPainter *painter, bool localAntialiased, QCP::AntialiasedElement overrideElement) const |
| virtual void | parentPlotInitialized (QCustomPlot *parentPlot) |
| void | initializeParentPlot (QCustomPlot *parentPlot) |
| void | setParentLayerable (QCPLayerable *parentLayerable) |
| bool | moveToLayer (QCPLayer *layer, bool prepend) |
| void | applyAntialiasingHint (QCPPainter *painter, bool localAntialiased, QCP::AntialiasedElement overrideElement) const |
Protected Attributes | |
| QCPScatterStyle | mScatterStyle |
| int | mScatterSkip |
| LineStyle | mLineStyle |
| QCPCurveDataMap * | mData |
| Protected Attributes inherited from QCPAbstractPlottable1D< QCPCurveData > | |
| QSharedPointer< QCPDataContainer< QCPCurveData > > | mDataContainer |
| Protected Attributes inherited from QCPAbstractPlottable | |
| QString | mName |
| bool | mAntialiasedFill |
| bool | mAntialiasedScatters |
| QPen | mPen |
| QBrush | mBrush |
| QPointer< QCPAxis > | mKeyAxis |
| QPointer< QCPAxis > | mValueAxis |
| QCP::SelectionType | mSelectable |
| QCPDataSelection | mSelection |
| QCPSelectionDecorator * | mSelectionDecorator |
| bool | mAntialiasedErrorBars |
| QPen | mSelectedPen |
| QBrush | mSelectedBrush |
| bool | mSelectable |
| bool | mSelected |
| Protected Attributes inherited from QCPLayerable | |
| bool | mVisible |
| QCustomPlot * | mParentPlot |
| QPointer< QCPLayerable > | mParentLayerable |
| QCPLayer * | mLayer |
| bool | mAntialiased |
Additional Inherited Members | |
| Signals inherited from QCPAbstractPlottable | |
| void | selectionChanged (bool selected) |
| void | selectionChanged (const QCPDataSelection &selection) |
| void | selectableChanged (QCP::SelectionType selectable) |
| void | selectionChanged (bool selected) |
| void | selectableChanged (bool selectable) |
| Signals inherited from QCPLayerable | |
| void | layerChanged (QCPLayer *newLayer) |
| void | layerChanged (QCPLayer *newLayer) |
| Protected Types inherited from QCPAbstractPlottable | |
| enum | SignDomain { sdNegative , sdBoth , sdPositive } |
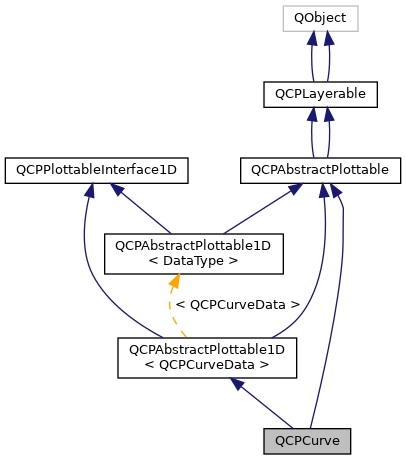
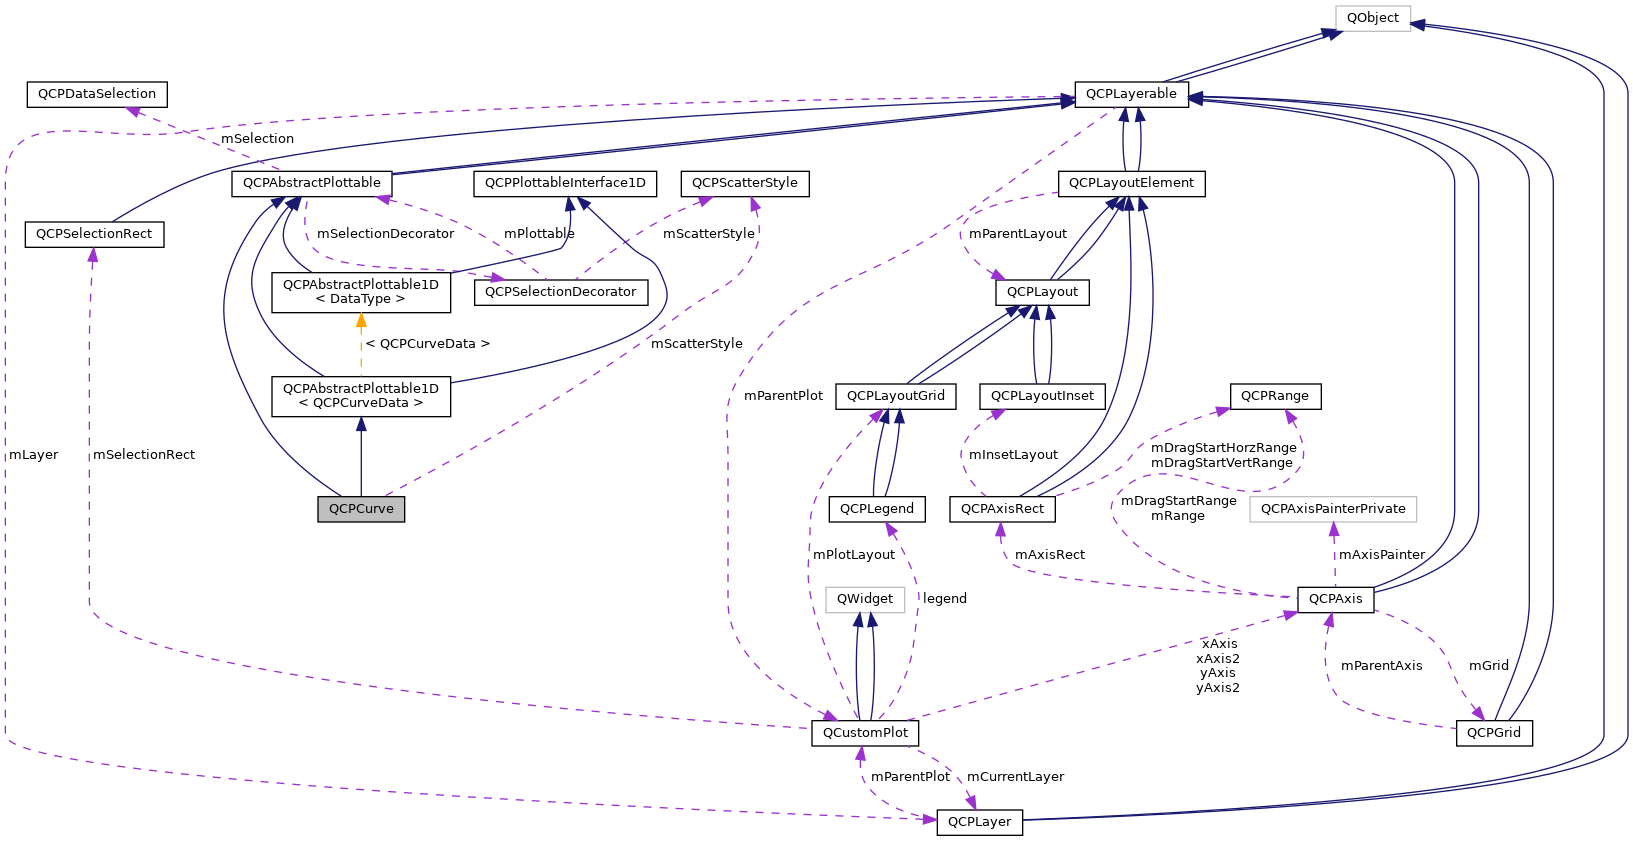
A plottable representing a parametric curve in a plot.

Unlike QCPGraph, plottables of this type may have multiple points with the same key coordinate, so their visual representation can have loops. This is realized by introducing a third coordinate t, which defines the order of the points described by the other two coordinates x and y.
To plot data, assign it with the setData or addData functions. Alternatively, you can also access and modify the curve's data via the data method, which returns a pointer to the internal QCPCurveDataContainer.
Gaps in the curve can be created by adding data points with NaN as key and value (qQNaN() or std::numeric_limits<double>::quiet_NaN()) in between the two data points that shall be separated.
The appearance of the curve is determined by the pen and the brush (setPen, setBrush).
Like all data representing objects in QCustomPlot, the QCPCurve is a plottable (QCPAbstractPlottable). So the plottable-interface of QCustomPlot applies (QCustomPlot::plottable, QCustomPlot::removePlottable, etc.)
Usually, you first create an instance:
which registers it with the QCustomPlot instance of the passed axes. Note that this QCustomPlot instance takes ownership of the plottable, so do not delete it manually but use QCustomPlot::removePlottable() instead. The newly created plottable can be modified, e.g.:
Unlike QCPGraph, plottables of this type may have multiple points with the same key coordinate, so their visual representation can have loops. This is realized by introducing a third coordinate t, which defines the order of the points described by the other two coordinates x and y.
To plot data, assign it with the setData or addData functions.
Gaps in the curve can be created by adding data points with NaN as key and value (qQNaN() or std::numeric_limits<double>::quiet_NaN()) in between the two data points that shall be separated.
The appearance of the curve is determined by the pen and the brush (setPen, setBrush).
Like all data representing objects in QCustomPlot, the QCPCurve is a plottable (QCPAbstractPlottable). So the plottable-interface of QCustomPlot applies (QCustomPlot::plottable, QCustomPlot::addPlottable, QCustomPlot::removePlottable, etc.)
Usually, you first create an instance and add it to the customPlot:
and then modify the properties of the newly created plottable, e.g.:
Definition at line 6198 of file qcustomplot.h.
| enum QCPCurve::LineStyle |
Defines how the curve's line is represented visually in the plot. The line is drawn with the current pen of the curve (setPen).
Definition at line 6212 of file qcustomplot.h.
| enum QCPCurve::LineStyle |
Defines how the curve's line is represented visually in the plot. The line is drawn with the current pen of the curve (setPen).
Definition at line 3220 of file qcustomplot.h.
Constructs a curve which uses keyAxis as its key axis ("x") and valueAxis as its value axis ("y"). keyAxis and valueAxis must reside in the same QCustomPlot instance and not have the same orientation. If either of these restrictions is violated, a corresponding message is printed to the debug output (qDebug), the construction is not aborted, though.
The created QCPCurve is automatically registered with the QCustomPlot instance inferred from keyAxis. This QCustomPlot instance takes ownership of the QCPCurve, so do not delete it manually but use QCustomPlot::removePlottable() instead.
Constructs a curve which uses keyAxis as its key axis ("x") and valueAxis as its value axis ("y"). keyAxis and valueAxis must reside in the same QCustomPlot instance and not have the same orientation. If either of these restrictions is violated, a corresponding message is printed to the debug output (qDebug), the construction is not aborted, though.
The constructed QCPCurve can be added to the plot with QCustomPlot::addPlottable, QCustomPlot then takes ownership of the graph.
Definition at line 22857 of file qcustomplot.cpp.
References ecvColor::blue(), lsLine, QCPAbstractPlottable::setBrush(), setLineStyle(), QCPAbstractPlottable::setPen(), setScatterSkip(), and setScatterStyle().
|
virtual |
Definition at line 22868 of file qcustomplot.cpp.
|
virtual |
| void QCPCurve::addData | ( | const QCPCurveData & | data | ) |
This is an overloaded member function, provided for convenience. It differs from the above function only in what argument(s) it accepts. Adds the provided single data point in data to the current data.
Definition at line 17570 of file qcustomplot.cpp.
References data(), mData, and qtCompatMapInsertMulti().
| void QCPCurve::addData | ( | const QCPCurveDataMap & | dataMap | ) |
Adds the provided data points in dataMap to the current data.
Definition at line 17562 of file qcustomplot.cpp.
References mData, and qtCompatMapUnite().
| void QCPCurve::addData | ( | const QVector< double > & | keys, |
| const QVector< double > & | values | ||
| ) |
This is an overloaded member function, provided for convenience. It differs from the above function only in what argument(s) it accepts.
Adds the provided points in keys and values to the current data. The provided vectors should have equal length. Else, the number of added points will be the size of the smallest vector.
The t parameter of each data point will be set to the integer index of the respective key/value pair.
Alternatively, you can also access and modify the data directly via the data method, which returns a pointer to the internal data container.
Definition at line 23013 of file qcustomplot.cpp.
References QCPAbstractPlottable1D< QCPCurveData >::mDataContainer.
| void QCPCurve::addData | ( | const QVector< double > & | t, |
| const QVector< double > & | keys, | ||
| const QVector< double > & | values, | ||
| bool | alreadySorted = false |
||
| ) |
This is an overloaded member function, provided for convenience. It differs from the above function only in what argument(s) it accepts.
Adds the provided points in t, keys and values to the current data. The provided vectors should have equal length. Else, the number of added points will be the size of the smallest vector.
If you can guarantee that the passed data points are sorted by keys in ascending order, you can set alreadySorted to true, to improve performance by saving a sorting run.
Alternatively, you can also access and modify the data directly via the data method, which returns a pointer to the internal data container.
Definition at line 22976 of file qcustomplot.cpp.
References QCPAbstractPlottable1D< QCPCurveData >::mDataContainer.
Referenced by setData().
| void QCPCurve::addData | ( | const QVector< double > & | ts, |
| const QVector< double > & | keys, | ||
| const QVector< double > & | values | ||
| ) |
This is an overloaded member function, provided for convenience. It differs from the above function only in what argument(s) it accepts. Adds the provided data points as t, key and value tuples to the current data.
Definition at line 17609 of file qcustomplot.cpp.
References QCPCurveData::key, mData, qtCompatMapInsertMulti(), QCPCurveData::t, and QCPCurveData::value.
| void QCPCurve::addData | ( | double | key, |
| double | value | ||
| ) |
This is an overloaded member function, provided for convenience. It differs from the above function only in what argument(s) it accepts.
Adds the provided data point as key and value to the current data.
The t parameter is generated automatically by increments of 1 for each point, starting at the highest t of previously existing data or 0, if the curve data is empty.
Alternatively, you can also access and modify the data directly via the data method, which returns a pointer to the internal data container.
This is an overloaded member function, provided for convenience. It differs from the above function only in what argument(s) it accepts.
Adds the provided single data point as key and value pair to the current data The t parameter of the data point is set to the t of the last data point plus 1. If there is no last data point, t will be set to 0.
Definition at line 23061 of file qcustomplot.cpp.
References QCPAbstractPlottable1D< QCPCurveData >::mDataContainer.
| void QCPCurve::addData | ( | double | key, |
| double | value | ||
| ) |
| void QCPCurve::addData | ( | double | t, |
| double | key, | ||
| double | value | ||
| ) |
This is an overloaded member function, provided for convenience. It differs from the above function only in what argument(s) it accepts. Adds the provided data point as t, key and value to the current data.
Alternatively, you can also access and modify the data directly via the data method, which returns a pointer to the internal data container.
This is an overloaded member function, provided for convenience. It differs from the above function only in what argument(s) it accepts. Adds the provided single data point as t, key and value tuple to the current data
Definition at line 23046 of file qcustomplot.cpp.
References QCPAbstractPlottable1D< QCPCurveData >::mDataContainer.
| void QCPCurve::addData | ( | double | t, |
| double | key, | ||
| double | value | ||
| ) |
|
virtual |
Removes all data points.
Implements QCPAbstractPlottable.
Definition at line 17672 of file qcustomplot.cpp.
References mData.
|
inline |
Returns a shared pointer to the internal data storage of type QCPCurveDataContainer. You may use it to directly manipulate the data, which may be more convenient and faster than using the regular setData or addData methods.
Definition at line 6223 of file qcustomplot.h.
|
inline |
Definition at line 3229 of file qcustomplot.h.
|
protectedvirtual |
Implements QCPAbstractPlottable.
Definition at line 23113 of file qcustomplot.cpp.
References QCPDataRange::adjusted(), QCPSelectionDecorator::applyBrush(), QCPAbstractPlottable::applyFillAntialiasingHint(), drawCurveLine(), QCPSelectionDecorator::drawDecoration(), drawScatterPlot(), getCurveLines(), QCPAbstractPlottable1D< QCPCurveData >::getDataSegments(), QCPSelectionDecorator::getFinalScatterStyle(), getScatters(), QCP::isInvalidData(), QCPScatterStyle::isNone(), lsNone, QCPAbstractPlottable::mBrush, QCPAbstractPlottable1D< QCPCurveData >::mDataContainer, mLineStyle, QCPAbstractPlottable::mPen, mScatterStyle, QCPAbstractPlottable::mSelectionDecorator, QCPAbstractPlottable::name(), QCPSelectionDecorator::pen(), QCPAbstractPlottable::selection(), QCPPainter::setPen(), and QCPScatterStyle::size().
|
protectedvirtual |
Implements QCPAbstractPlottable.
|
protectedvirtual |
Definition at line 23237 of file qcustomplot.cpp.
References QCPAbstractPlottable::applyDefaultAntialiasingHint(), and QCPAbstractPlottable1D< QCPCurveData >::drawPolyline().
Referenced by draw().
|
protectedvirtual |
Implements QCPAbstractPlottable.
Definition at line 23193 of file qcustomplot.cpp.
References QCPAbstractPlottable::applyDefaultAntialiasingHint(), QCPAbstractPlottable::applyFillAntialiasingHint(), QCPAbstractPlottable::applyScattersAntialiasingHint(), QCPScatterStyle::applyTo(), QCPPainter::drawLine(), QCPScatterStyle::drawShape(), QCPScatterStyle::isNone(), lsNone, QCPAbstractPlottable::mBrush, mLineStyle, QCPAbstractPlottable::mPen, mScatterStyle, QCPScatterStyle::pixmap(), QCPPainter::setPen(), QCPScatterStyle::setPixmap(), QCPScatterStyle::shape(), and QCPScatterStyle::ssPixmap.
|
protectedvirtual |
Implements QCPAbstractPlottable.
|
protectedvirtual |
Definition at line 23254 of file qcustomplot.cpp.
References QCPAbstractPlottable::applyScattersAntialiasingHint(), QCPScatterStyle::applyTo(), QCPScatterStyle::drawShape(), QCPAbstractPlottable::mPen, and points.
Referenced by draw().
|
protectedvirtual |
Definition at line 17830 of file qcustomplot.cpp.
References QCPAbstractPlottable::applyScattersAntialiasingHint(), QCPScatterStyle::applyTo(), QCPScatterStyle::drawShape(), QCPAbstractPlottable::mPen, and mScatterStyle.
|
protected |
Definition at line 17855 of file qcustomplot.cpp.
References QCPAbstractPlottable::coordsToPixels(), QCPAxis::coordToPixel(), getOptimizedCornerPoints(), getOptimizedPoint(), getRegion(), getTraverse(), getTraverseCornerPoints(), QCPScatterStyle::isNone(), QCPAbstractPlottable::keyAxis(), QCPRange::lower, QCPAbstractPlottable::mainPen(), mayTraverse(), mData, QCPAbstractPlottable::mKeyAxis, mScatterStyle, QCPAbstractPlottable::mValueAxis, QCPAxis::orientation(), QCPAxis::pixelToCoord(), QCPAxis::range(), QCPAxis::rangeReversed(), QCPScatterStyle::size(), QCPRange::upper, and QCPAbstractPlottable::valueAxis().
Referenced by pointDistance().
|
protected |
Definition at line 23296 of file qcustomplot.cpp.
References QCPAbstractPlottable::coordsToPixels(), QCPAxis::coordToPixel(), getOptimizedCornerPoints(), getOptimizedPoint(), getRegion(), getTraverse(), getTraverseCornerPoints(), QCPAbstractPlottable::keyAxis(), QCPRange::lower, mayTraverse(), QCPAbstractPlottable1D< QCPCurveData >::mDataContainer, QCPAbstractPlottable::mKeyAxis, QCPAbstractPlottable::mValueAxis, QCPAxis::pixelOrientation(), QCPAxis::pixelToCoord(), QCPAxis::range(), QCPRange::upper, and QCPAbstractPlottable::valueAxis().
Referenced by draw(), and pointDistance().
|
virtual |
Returns the coordinate range that all data in this plottable span in the key axis dimension. For logarithmic plots, one can set inSignDomain to either QCP::sdNegative or QCP::sdPositive in order to restrict the returned range to that sign domain. E.g. when only negative range is wanted, set inSignDomain to QCP::sdNegative and all positive points will be ignored for range calculation. For no restriction, just set inSignDomain to QCP::sdBoth (default). foundRange is an output parameter that indicates whether a range could be found or not. If this is false, you shouldn't use the returned range (e.g. no points in data).
Note that foundRange is not the same as QCPRange::validRange, since the range returned by this function may have size zero (e.g. when there is only one data point). In this case foundRange would return true, but the returned range is not a valid range in terms of QCPRange::validRange.
Implements QCPAbstractPlottable.
Definition at line 23100 of file qcustomplot.cpp.
References QCPAbstractPlottable1D< QCPCurveData >::mDataContainer.
|
protectedvirtual |
Implements QCPAbstractPlottable.
Definition at line 19013 of file qcustomplot.cpp.
References QCPRange::lower, mData, QCPAbstractPlottable::sdBoth, QCPAbstractPlottable::sdNegative, QCPAbstractPlottable::sdPositive, and QCPRange::upper.
|
protected |
Definition at line 23784 of file qcustomplot.cpp.
References QCPAbstractPlottable::coordsToPixels(), and result.
Referenced by getCurveData(), and getCurveLines().
|
protected |
|
protected |
Definition at line 23606 of file qcustomplot.cpp.
References QCPAbstractPlottable::mKeyAxis, and QCPAbstractPlottable::mValueAxis.
Referenced by getCurveData(), and getCurveLines().
|
protected |
|
protected |
Definition at line 23556 of file qcustomplot.cpp.
Referenced by getCurveData(), and getCurveLines().
|
protected |
|
protected |
Definition at line 23447 of file qcustomplot.cpp.
References QCPRange::contains(), QCPAxis::coordToPixel(), QCPAbstractPlottable::keyAxis(), QCPRange::lower, QCPAbstractPlottable1D< QCPCurveData >::mDataContainer, QCPAbstractPlottable::mKeyAxis, mScatterSkip, QCPAbstractPlottable::mValueAxis, QCPAxis::orientation(), QCPAxis::pixelOrientation(), QCPAxis::pixelToCoord(), QCPAxis::range(), QCPRange::upper, and QCPAbstractPlottable::valueAxis().
Referenced by draw().
|
protected |
Definition at line 24295 of file qcustomplot.cpp.
References QCPAbstractPlottable::mKeyAxis, and QCPAbstractPlottable::mValueAxis.
Referenced by getCurveData(), and getCurveLines().
|
protected |
|
protected |
Definition at line 24454 of file qcustomplot.cpp.
References QCPAbstractPlottable::coordsToPixels().
Referenced by getCurveData(), and getCurveLines().
|
protected |
|
virtual |
Returns the coordinate range that the data points in the specified key range (inKeyRange) span in the value axis dimension. For logarithmic plots, one can set inSignDomain to either QCP::sdNegative or QCP::sdPositive in order to restrict the returned range to that sign domain. E.g. when only negative range is wanted, set inSignDomain to QCP::sdNegative and all positive points will be ignored for range calculation. For no restriction, just set inSignDomain to QCP::sdBoth (default). foundRange is an output parameter that indicates whether a range could be found or not. If this is false, you shouldn't use the returned range (e.g. no points in data).
If inKeyRange has both lower and upper bound set to zero (is equal to QCPRange()), all data points are considered, without any restriction on the keys.
Note that foundRange is not the same as QCPRange::validRange, since the range returned by this function may have size zero (e.g. when there is only one data point). In this case foundRange would return true, but the returned range is not a valid range in terms of QCPRange::validRange.
Implements QCPAbstractPlottable.
Definition at line 23106 of file qcustomplot.cpp.
References QCPAbstractPlottable1D< QCPCurveData >::mDataContainer.
|
protectedvirtual |
called by rescaleAxes functions to get the full data value bounds. For logarithmic plots, one can set inSignDomain to either sdNegative or sdPositive in order to restrict the returned range to that sign domain. E.g. when only negative range is wanted, set inSignDomain to sdNegative and all positive points will be ignored for range calculation. For no restriction, just set inSignDomain to sdBoth (default). foundRange is an output parameter that indicates whether a range could be found or not. If this is false, you shouldn't use the returned range (e.g. no points in data).
Note that foundRange is not the same as QCPRange::validRange, since the range returned by this function may have size zero, which wouldn't count as a valid range.
Implements QCPAbstractPlottable.
Definition at line 19046 of file qcustomplot.cpp.
References QCPRange::lower, mData, QCPAbstractPlottable::sdBoth, QCPAbstractPlottable::sdNegative, QCPAbstractPlottable::sdPositive, and QCPRange::upper.
|
inline |
Definition at line 6228 of file qcustomplot.h.
|
inline |
Definition at line 3231 of file qcustomplot.h.
|
protected |
Definition at line 24190 of file qcustomplot.cpp.
Referenced by getCurveData(), and getCurveLines().
|
protected |
|
protected |
Definition at line 18987 of file qcustomplot.cpp.
References QCPAbstractPlottable::coordsToPixels(), QCPAbstractPlottable::distSqrToLine(), getCurveData(), mData, and QCPAbstractPlottable::mName.
|
protected |
Definition at line 24607 of file qcustomplot.cpp.
References QCPAbstractPlottable::coordsToPixels(), QCPAbstractPlottable1D< QCPCurveData >::dataCount(), QCPVector2D::distanceSquaredToLine(), getCurveLines(), QCPScatterStyle::isNone(), QCPVector2D::length(), QCPVector2D::lengthSquared(), lsNone, QCPAbstractPlottable1D< QCPCurveData >::mDataContainer, mLineStyle, QCPLayerable::mParentPlot, mScatterStyle, and QCustomPlot::selectionTolerance().
Referenced by selectTest().
| void QCPCurve::removeData | ( | double | fromt, |
| double | tot | ||
| ) |
Removes all data points with curve parameter t between fromt and tot. if fromt is greater or equal to tot, the function does nothing. To remove a single data point with known t, use removeData(double t).
Definition at line 17650 of file qcustomplot.cpp.
References mData.
| void QCPCurve::removeData | ( | double | t | ) |
This is an overloaded member function, provided for convenience. It differs from the above function only in what argument(s) it accepts.
Removes a single data point at curve parameter t. If the position is not known with absolute precision, consider using removeData(double fromt, double tot) with a small fuzziness interval around the suspected position, depeding on the precision with which the curve parameter is known.
Definition at line 17666 of file qcustomplot.cpp.
References mData.
| void QCPCurve::removeDataAfter | ( | double | t | ) |
Removes all data points with curve parameter t greater than t.
Definition at line 17637 of file qcustomplot.cpp.
References mData.
| void QCPCurve::removeDataBefore | ( | double | t | ) |
Removes all data points with curve parameter t smaller than t.
Definition at line 17628 of file qcustomplot.cpp.
References mData.
|
inline |
Definition at line 6227 of file qcustomplot.h.
|
inline |
Definition at line 6226 of file qcustomplot.h.
|
inline |
Definition at line 3230 of file qcustomplot.h.
|
virtual |
Implements a selectTest specific to this plottable's point geometry.
If details is not 0, it will be set to a QCPDataSelection, describing the closest data point to pos.
\seebaseclassmethod QCPAbstractPlottable::selectTest
Implements QCPAbstractPlottable.
Definition at line 23077 of file qcustomplot.cpp.
References QCPAbstractPlottable1D< QCPCurveData >::mDataContainer, QCPAbstractPlottable::mKeyAxis, QCPAbstractPlottable::mSelectable, QCPAbstractPlottable::mValueAxis, pointDistance(), result, and QCP::stNone.
|
virtual |
This function is used to decide whether a click hits a layerable object or not.
pos is a point in pixel coordinates on the QCustomPlot surface. This function returns the shortest pixel distance of this point to the object. If the object is either invisible or the distance couldn't be determined, -1.0 is returned. Further, if onlySelectable is true and the object is not selectable, -1.0 is returned, too.
If the object is represented not by single lines but by an area like a QCPItemText or the bars of a QCPBars plottable, a click inside the area should also be considered a hit. In these cases this function thus returns a constant value greater zero but still below the parent plot's selection tolerance. (typically the selectionTolerance multiplied by 0.99).
Providing a constant value for area objects allows selecting line objects even when they are obscured by such area objects, by clicking close to the lines (i.e. closer than 0.99*selectionTolerance).
The actual setting of the selection state is not done by this function. This is handled by the parent QCustomPlot when the mouseReleaseEvent occurs, and the finally selected object is notified via the selectEvent/ deselectEvent methods.
details is an optional output parameter. Every layerable subclass may place any information in details. This information will be passed to selectEvent when the parent QCustomPlot decides on the basis of this selectTest call, that the object was successfully selected. The subsequent call to selectEvent will carry the details. This is useful for multi-part objects (like QCPAxis). This way, a possibly complex calculation to decide which part was clicked is only done once in selectTest. The result (i.e. the actually clicked part) can then be placed in details. So in the subsequent selectEvent, the decision which part was selected doesn't have to be done a second time for a single selection operation.
In the case of 1D Plottables (QCPAbstractPlottable1D, like QCPGraph or QCPBars) details will be set to a QCPDataSelection, describing the closest data point to pos.
You may pass 0 as details to indicate that you are not interested in those selection details.
This function is used to decide whether a click hits a layerable object or not.
pos is a point in pixel coordinates on the QCustomPlot surface. This function returns the shortest pixel distance of this point to the object. If the object is either invisible or the distance couldn't be determined, -1.0 is returned. Further, if onlySelectable is true and the object is not selectable, -1.0 is returned, too.
If the object is represented not by single lines but by an area like a QCPItemText or the bars of a QCPBars plottable, a click inside the area should also be considered a hit. In these cases this function thus returns a constant value greater zero but still below the parent plot's selection tolerance. (typically the selectionTolerance multiplied by 0.99).
Providing a constant value for area objects allows selecting line objects even when they are obscured by such area objects, by clicking close to the lines (i.e. closer than 0.99*selectionTolerance).
The actual setting of the selection state is not done by this function. This is handled by the parent QCustomPlot when the mouseReleaseEvent occurs, and the finally selected object is notified via the selectEvent/deselectEvent methods.
details is an optional output parameter. Every layerable subclass may place any information in details. This information will be passed to selectEvent when the parent QCustomPlot decides on the basis of this selectTest call, that the object was successfully selected. The subsequent call to selectEvent will carry the details. This is useful for multi-part objects (like QCPAxis). This way, a possibly complex calculation to decide which part was clicked is only done once in selectTest. The result (i.e. the actually clicked part) can then be placed in details. So in the subsequent selectEvent, the decision which part was selected doesn't have to be done a second time for a single selection operation.
You may pass 0 as details to indicate that you are not interested in those selection details.
Implements QCPAbstractPlottable.
| void QCPCurve::setData | ( | const QVector< double > & | key, |
| const QVector< double > & | value | ||
| ) |
| void QCPCurve::setData | ( | const QVector< double > & | key, |
| const QVector< double > & | value | ||
| ) |
This is an overloaded member function, provided for convenience. It differs from the above function only in what argument(s) it accepts.
Replaces the current data with the provided points in keys and values. The provided vectors should have equal length. Else, the number of added points will be the size of the smallest vector.
The t parameter of each data point will be set to the integer index of the respective key/value pair.
This is an overloaded member function, provided for convenience. It differs from the above function only in what argument(s) it accepts.
Replaces the current data with the provided key and value pairs. The t parameter of each data point will be set to the integer index of the respective key/value pair.
Definition at line 22922 of file qcustomplot.cpp.
References addData(), and QCPAbstractPlottable1D< QCPCurveData >::mDataContainer.
| void QCPCurve::setData | ( | const QVector< double > & | t, |
| const QVector< double > & | key, | ||
| const QVector< double > & | value | ||
| ) |
This is an overloaded member function, provided for convenience. It differs from the above function only in what argument(s) it accepts.
Replaces the current data with the provided points in t, key and value tuples. The provided vectors should have equal length. Else, the number of added points will be the size of the smallest vector.
Definition at line 17500 of file qcustomplot.cpp.
References QCPCurveData::key, mData, qtCompatMapInsertMulti(), QCPCurveData::t, and QCPCurveData::value.
| void QCPCurve::setData | ( | const QVector< double > & | t, |
| const QVector< double > & | keys, | ||
| const QVector< double > & | values, | ||
| bool | alreadySorted = false |
||
| ) |
This is an overloaded member function, provided for convenience. It differs from the above function only in what argument(s) it accepts.
Replaces the current data with the provided points in t, keys and values. The provided vectors should have equal length. Else, the number of added points will be the size of the smallest vector.
If you can guarantee that the passed data points are sorted by t in ascending order, you can set alreadySorted to true, to improve performance by saving a sorting run.
Definition at line 22903 of file qcustomplot.cpp.
References addData(), and QCPAbstractPlottable1D< QCPCurveData >::mDataContainer.
| void QCPCurve::setData | ( | QCPCurveDataMap * | data, |
| bool | copy = false |
||
| ) |
Replaces the current data with the provided data.
If copy is set to true, data points in data will only be copied. if false, the plottable takes ownership of the passed data and replaces the internal data pointer with it. This is significantly faster than copying for large datasets.
Definition at line 17478 of file qcustomplot.cpp.
| void QCPCurve::setData | ( | QSharedPointer< QCPCurveDataContainer > | data | ) |
This is an overloaded member function, provided for convenience. It differs from the above function only in what argument(s) it accepts.
Replaces the current data container with the provided data container.
Since a QSharedPointer is used, multiple QCPCurves may share the same data container safely. Modifying the data in the container will then affect all curves that share the container. Sharing can be achieved by simply exchanging the data containers wrapped in shared pointers:
If you do not wish to share containers, but create a copy from an existing container, rather use the QCPDataContainer<DataType>::set method on the curve's data container directly:
Definition at line 22887 of file qcustomplot.cpp.
References data(), and QCPAbstractPlottable1D< QCPCurveData >::mDataContainer.
| void QCPCurve::setLineStyle | ( | QCPCurve::LineStyle | style | ) |
Sets how the single data points are connected in the plot or how they are represented visually apart from the scatter symbol. For scatter-only plots, set style to lsNone and setScatterStyle to the desired scatter style.
Definition at line 22961 of file qcustomplot.cpp.
References mLineStyle.
Referenced by QCPCurve().
| void QCPCurve::setLineStyle | ( | LineStyle | style | ) |
| void QCPCurve::setScatterSkip | ( | int | skip | ) |
If scatters are displayed (scatter style not QCPScatterStyle::ssNone), skip number of scatter points are skipped/not drawn after every drawn scatter point.
This can be used to make the data appear sparser while for example still having a smooth line, and to improve performance for very high density plots.
If skip is set to 0 (default), all scatter points are drawn.
Definition at line 22951 of file qcustomplot.cpp.
References mScatterSkip.
Referenced by QCPCurve().
| void QCPCurve::setScatterStyle | ( | const QCPScatterStyle & | style | ) |
Sets the visual appearance of single data points in the plot. If set to QCPScatterStyle::ssNone, no scatter points are drawn (e.g. for line-only plots with appropriate line style).
Definition at line 22935 of file qcustomplot.cpp.
References mScatterStyle.
Referenced by QCPCurve().
| void QCPCurve::setScatterStyle | ( | const QCPScatterStyle & | style | ) |
|
protected |
Definition at line 3263 of file qcustomplot.h.
Referenced by addData(), clearData(), getCurveData(), getKeyRange(), getValueRange(), pointDistance(), removeData(), removeDataAfter(), removeDataBefore(), and setData().
|
protected |
Definition at line 6266 of file qcustomplot.h.
Referenced by draw(), drawLegendIcon(), pointDistance(), and setLineStyle().
|
protected |
Definition at line 6265 of file qcustomplot.h.
Referenced by getScatters(), and setScatterSkip().
|
protected |
Definition at line 6264 of file qcustomplot.h.
Referenced by draw(), drawLegendIcon(), drawScatterPlot(), getCurveData(), pointDistance(), and setScatterStyle().