|
ACloudViewer
3.9.4
A Modern Library for 3D Data Processing
|
|
ACloudViewer
3.9.4
A Modern Library for 3D Data Processing
|
A plottable representing a graph in a plot. More...
#include <qcustomplot.h>
Public Types | |
| enum | LineStyle { lsNone , lsLine , lsStepLeft , lsStepRight , lsStepCenter , lsImpulse , lsNone , lsLine , lsStepLeft , lsStepRight , lsStepCenter , lsImpulse } |
| enum | LineStyle { lsNone , lsLine , lsStepLeft , lsStepRight , lsStepCenter , lsImpulse , lsNone , lsLine , lsStepLeft , lsStepRight , lsStepCenter , lsImpulse } |
| enum | ErrorType { etNone , etKey , etValue , etBoth } |
Public Member Functions | |
| QCPGraph (QCPAxis *keyAxis, QCPAxis *valueAxis) | |
| virtual | ~QCPGraph () |
| QSharedPointer< QCPGraphDataContainer > | data () const |
| LineStyle | lineStyle () const |
| QCPScatterStyle | scatterStyle () const |
| int | scatterSkip () const |
| QCPGraph * | channelFillGraph () const |
| bool | adaptiveSampling () const |
| void | setData (QSharedPointer< QCPGraphDataContainer > data) |
| void | setData (const QVector< double > &keys, const QVector< double > &values, bool alreadySorted=false) |
| void | setLineStyle (LineStyle ls) |
| void | setScatterStyle (const QCPScatterStyle &style) |
| void | setScatterSkip (int skip) |
| void | setChannelFillGraph (QCPGraph *targetGraph) |
| void | setAdaptiveSampling (bool enabled) |
| void | addData (const QVector< double > &keys, const QVector< double > &values, bool alreadySorted=false) |
| void | addData (double key, double value) |
| virtual double | selectTest (const QPointF &pos, bool onlySelectable, QVariant *details=0) const |
| virtual QCPRange | getKeyRange (bool &foundRange, QCP::SignDomain inSignDomain=QCP::sdBoth) const |
| virtual QCPRange | getValueRange (bool &foundRange, QCP::SignDomain inSignDomain=QCP::sdBoth, const QCPRange &inKeyRange=QCPRange()) const |
| QCPGraph (QCPAxis *keyAxis, QCPAxis *valueAxis) | |
| virtual | ~QCPGraph () |
| QCPDataMap * | data () const |
| LineStyle | lineStyle () const |
| QCPScatterStyle | scatterStyle () const |
| ErrorType | errorType () const |
| QPen | errorPen () const |
| double | errorBarSize () const |
| bool | errorBarSkipSymbol () const |
| QCPGraph * | channelFillGraph () const |
| bool | adaptiveSampling () const |
| void | setData (QCPDataMap *data, bool copy=false) |
| void | setData (const QVector< double > &key, const QVector< double > &value) |
| void | setDataKeyError (const QVector< double > &key, const QVector< double > &value, const QVector< double > &keyError) |
| void | setDataKeyError (const QVector< double > &key, const QVector< double > &value, const QVector< double > &keyErrorMinus, const QVector< double > &keyErrorPlus) |
| void | setDataValueError (const QVector< double > &key, const QVector< double > &value, const QVector< double > &valueError) |
| void | setDataValueError (const QVector< double > &key, const QVector< double > &value, const QVector< double > &valueErrorMinus, const QVector< double > &valueErrorPlus) |
| void | setDataBothError (const QVector< double > &key, const QVector< double > &value, const QVector< double > &keyError, const QVector< double > &valueError) |
| void | setDataBothError (const QVector< double > &key, const QVector< double > &value, const QVector< double > &keyErrorMinus, const QVector< double > &keyErrorPlus, const QVector< double > &valueErrorMinus, const QVector< double > &valueErrorPlus) |
| void | setLineStyle (LineStyle ls) |
| void | setScatterStyle (const QCPScatterStyle &style) |
| void | setErrorType (ErrorType errorType) |
| void | setErrorPen (const QPen &pen) |
| void | setErrorBarSize (double size) |
| void | setErrorBarSkipSymbol (bool enabled) |
| void | setChannelFillGraph (QCPGraph *targetGraph) |
| void | setAdaptiveSampling (bool enabled) |
| void | addData (const QCPDataMap &dataMap) |
| void | addData (const QCPData &data) |
| void | addData (double key, double value) |
| void | addData (const QVector< double > &keys, const QVector< double > &values) |
| void | removeDataBefore (double key) |
| void | removeDataAfter (double key) |
| void | removeData (double fromKey, double toKey) |
| void | removeData (double key) |
| virtual void | clearData () |
| virtual double | selectTest (const QPointF &pos, bool onlySelectable, QVariant *details=0) const |
| void | rescaleAxes (bool onlyEnlarge, bool includeErrorBars) const |
| void | rescaleKeyAxis (bool onlyEnlarge, bool includeErrorBars) const |
| void | rescaleValueAxis (bool onlyEnlarge, bool includeErrorBars) const |
| void | rescaleAxes (bool onlyEnlarge=false) const |
| void | rescaleAxes (bool onlyEnlarge=false) const |
| void | rescaleKeyAxis (bool onlyEnlarge=false) const |
| void | rescaleKeyAxis (bool onlyEnlarge=false) const |
| void | rescaleValueAxis (bool onlyEnlarge=false, bool inKeyRange=false) const |
| void | rescaleValueAxis (bool onlyEnlarge=false) const |
 Public Member Functions inherited from QCPAbstractPlottable1D< QCPGraphData > Public Member Functions inherited from QCPAbstractPlottable1D< QCPGraphData > | |
| QCPAbstractPlottable1D (QCPAxis *keyAxis, QCPAxis *valueAxis) | |
| virtual | ~QCPAbstractPlottable1D () |
| virtual int | dataCount () const |
| virtual double | dataMainKey (int index) const |
| virtual double | dataSortKey (int index) const |
| virtual double | dataMainValue (int index) const |
| virtual QCPRange | dataValueRange (int index) const |
| virtual QPointF | dataPixelPosition (int index) const |
| virtual bool | sortKeyIsMainKey () const |
| virtual QCPDataSelection | selectTestRect (const QRectF &rect, bool onlySelectable) const |
| virtual int | findBegin (double sortKey, bool expandedRange=true) const |
| virtual int | findEnd (double sortKey, bool expandedRange=true) const |
| virtual QCPPlottableInterface1D * | interface1D () |
| Public Member Functions inherited from QCPAbstractPlottable | |
| QCPAbstractPlottable (QCPAxis *keyAxis, QCPAxis *valueAxis) | |
| virtual | ~QCPAbstractPlottable () |
| QString | name () const |
| bool | antialiasedFill () const |
| bool | antialiasedScatters () const |
| QPen | pen () const |
| QBrush | brush () const |
| QCPAxis * | keyAxis () const |
| QCPAxis * | valueAxis () const |
| QCP::SelectionType | selectable () const |
| bool | selected () const |
| QCPDataSelection | selection () const |
| QCPSelectionDecorator * | selectionDecorator () const |
| void | setName (const QString &name) |
| void | setAntialiasedFill (bool enabled) |
| void | setAntialiasedScatters (bool enabled) |
| void | setPen (const QPen &pen) |
| void | setBrush (const QBrush &brush) |
| void | setKeyAxis (QCPAxis *axis) |
| void | setValueAxis (QCPAxis *axis) |
| Q_SLOT void | setSelectable (QCP::SelectionType selectable) |
| Q_SLOT void | setSelection (QCPDataSelection selection) |
| void | setSelectionDecorator (QCPSelectionDecorator *decorator) |
| void | coordsToPixels (double key, double value, double &x, double &y) const |
| const QPointF | coordsToPixels (double key, double value) const |
| void | pixelsToCoords (double x, double y, double &key, double &value) const |
| void | pixelsToCoords (const QPointF &pixelPos, double &key, double &value) const |
| void | rescaleAxes (bool onlyEnlarge=false) const |
| void | rescaleKeyAxis (bool onlyEnlarge=false) const |
| void | rescaleValueAxis (bool onlyEnlarge=false, bool inKeyRange=false) const |
| bool | addToLegend (QCPLegend *legend) |
| bool | addToLegend () |
| bool | removeFromLegend (QCPLegend *legend) const |
| bool | removeFromLegend () const |
| QCPAbstractPlottable (QCPAxis *keyAxis, QCPAxis *valueAxis) | |
| QString | name () const |
| bool | antialiasedFill () const |
| bool | antialiasedScatters () const |
| bool | antialiasedErrorBars () const |
| QPen | pen () const |
| QPen | selectedPen () const |
| QBrush | brush () const |
| QBrush | selectedBrush () const |
| QCPAxis * | keyAxis () const |
| QCPAxis * | valueAxis () const |
| bool | selectable () const |
| bool | selected () const |
| void | setName (const QString &name) |
| void | setAntialiasedFill (bool enabled) |
| void | setAntialiasedScatters (bool enabled) |
| void | setAntialiasedErrorBars (bool enabled) |
| void | setPen (const QPen &pen) |
| void | setSelectedPen (const QPen &pen) |
| void | setBrush (const QBrush &brush) |
| void | setSelectedBrush (const QBrush &brush) |
| void | setKeyAxis (QCPAxis *axis) |
| void | setValueAxis (QCPAxis *axis) |
| Q_SLOT void | setSelectable (bool selectable) |
| Q_SLOT void | setSelected (bool selected) |
| virtual bool | addToLegend () |
| virtual bool | removeFromLegend () const |
| void | rescaleAxes (bool onlyEnlarge=false) const |
| void | rescaleKeyAxis (bool onlyEnlarge=false) const |
| void | rescaleValueAxis (bool onlyEnlarge=false) const |
| Public Member Functions inherited from QCPLayerable | |
| QCPLayerable (QCustomPlot *plot, QString targetLayer=QString(), QCPLayerable *parentLayerable=0) | |
| virtual | ~QCPLayerable () |
| bool | visible () const |
| QCustomPlot * | parentPlot () const |
| QCPLayerable * | parentLayerable () const |
| QCPLayer * | layer () const |
| bool | antialiased () const |
| void | setVisible (bool on) |
| Q_SLOT bool | setLayer (QCPLayer *layer) |
| bool | setLayer (const QString &layerName) |
| void | setAntialiased (bool enabled) |
| bool | realVisibility () const |
| QCPLayerable (QCustomPlot *plot, QString targetLayer=QString(), QCPLayerable *parentLayerable=0) | |
| ~QCPLayerable () | |
| bool | visible () const |
| QCustomPlot * | parentPlot () const |
| QCPLayerable * | parentLayerable () const |
| QCPLayer * | layer () const |
| bool | antialiased () const |
| void | setVisible (bool on) |
| Q_SLOT bool | setLayer (QCPLayer *layer) |
| bool | setLayer (const QString &layerName) |
| void | setAntialiased (bool enabled) |
| bool | realVisibility () const |
| Public Member Functions inherited from QCPPlottableInterface1D | |
| virtual | ~QCPPlottableInterface1D () |
Protected Member Functions | |
| virtual void | draw (QCPPainter *painter) |
| virtual void | drawLegendIcon (QCPPainter *painter, const QRectF &rect) const |
| virtual void | drawFill (QCPPainter *painter, QVector< QPointF > *lines) const |
| virtual void | drawScatterPlot (QCPPainter *painter, const QVector< QPointF > &scatters, const QCPScatterStyle &style) const |
| virtual void | drawLinePlot (QCPPainter *painter, const QVector< QPointF > &lines) const |
| virtual void | drawImpulsePlot (QCPPainter *painter, const QVector< QPointF > &lines) const |
| virtual void | getOptimizedLineData (QVector< QCPGraphData > *lineData, const QCPGraphDataContainer::const_iterator &begin, const QCPGraphDataContainer::const_iterator &end) const |
| virtual void | getOptimizedScatterData (QVector< QCPGraphData > *scatterData, QCPGraphDataContainer::const_iterator begin, QCPGraphDataContainer::const_iterator end) const |
| void | getVisibleDataBounds (QCPGraphDataContainer::const_iterator &begin, QCPGraphDataContainer::const_iterator &end, const QCPDataRange &rangeRestriction) const |
| void | getLines (QVector< QPointF > *lines, const QCPDataRange &dataRange) const |
| void | getScatters (QVector< QPointF > *scatters, const QCPDataRange &dataRange) const |
| QVector< QPointF > | dataToLines (const QVector< QCPGraphData > &data) const |
| QVector< QPointF > | dataToStepLeftLines (const QVector< QCPGraphData > &data) const |
| QVector< QPointF > | dataToStepRightLines (const QVector< QCPGraphData > &data) const |
| QVector< QPointF > | dataToStepCenterLines (const QVector< QCPGraphData > &data) const |
| QVector< QPointF > | dataToImpulseLines (const QVector< QCPGraphData > &data) const |
| QVector< QCPDataRange > | getNonNanSegments (const QVector< QPointF > *lineData, Qt::Orientation keyOrientation) const |
| QVector< QPair< QCPDataRange, QCPDataRange > > | getOverlappingSegments (QVector< QCPDataRange > thisSegments, const QVector< QPointF > *thisData, QVector< QCPDataRange > otherSegments, const QVector< QPointF > *otherData) const |
| bool | segmentsIntersect (double aLower, double aUpper, double bLower, double bUpper, int &bPrecedence) const |
| QPointF | getFillBasePoint (QPointF matchingDataPoint) const |
| const QPolygonF | getFillPolygon (const QVector< QPointF > *lineData, QCPDataRange segment) const |
| const QPolygonF | getChannelFillPolygon (const QVector< QPointF > *lineData, QCPDataRange thisSegment, const QVector< QPointF > *otherData, QCPDataRange otherSegment) const |
| int | findIndexBelowX (const QVector< QPointF > *data, double x) const |
| int | findIndexAboveX (const QVector< QPointF > *data, double x) const |
| int | findIndexBelowY (const QVector< QPointF > *data, double y) const |
| int | findIndexAboveY (const QVector< QPointF > *data, double y) const |
| double | pointDistance (const QPointF &pixelPoint, QCPGraphDataContainer::const_iterator &closestData) const |
| virtual void | draw (QCPPainter *painter) |
| virtual void | drawLegendIcon (QCPPainter *painter, const QRectF &rect) const |
| virtual QCPRange | getKeyRange (bool &foundRange, SignDomain inSignDomain=sdBoth) const |
| virtual QCPRange | getValueRange (bool &foundRange, SignDomain inSignDomain=sdBoth) const |
| virtual QCPRange | getKeyRange (bool &foundRange, SignDomain inSignDomain, bool includeErrors) const |
| virtual QCPRange | getValueRange (bool &foundRange, SignDomain inSignDomain, bool includeErrors) const |
| virtual void | drawFill (QCPPainter *painter, QVector< QPointF > *lineData) const |
| virtual void | drawScatterPlot (QCPPainter *painter, QVector< QCPData > *scatterData) const |
| virtual void | drawLinePlot (QCPPainter *painter, QVector< QPointF > *lineData) const |
| virtual void | drawImpulsePlot (QCPPainter *painter, QVector< QPointF > *lineData) const |
| void | getPreparedData (QVector< QCPData > *lineData, QVector< QCPData > *scatterData) const |
| void | getPlotData (QVector< QPointF > *lineData, QVector< QCPData > *scatterData) const |
| void | getScatterPlotData (QVector< QCPData > *scatterData) const |
| void | getLinePlotData (QVector< QPointF > *linePixelData, QVector< QCPData > *scatterData) const |
| void | getStepLeftPlotData (QVector< QPointF > *linePixelData, QVector< QCPData > *scatterData) const |
| void | getStepRightPlotData (QVector< QPointF > *linePixelData, QVector< QCPData > *scatterData) const |
| void | getStepCenterPlotData (QVector< QPointF > *linePixelData, QVector< QCPData > *scatterData) const |
| void | getImpulsePlotData (QVector< QPointF > *linePixelData, QVector< QCPData > *scatterData) const |
| void | drawError (QCPPainter *painter, double x, double y, const QCPData &data) const |
| void | getVisibleDataBounds (QCPDataMap::const_iterator &lower, QCPDataMap::const_iterator &upper) const |
| int | countDataInBounds (const QCPDataMap::const_iterator &lower, const QCPDataMap::const_iterator &upper, int maxCount) const |
| void | addFillBasePoints (QVector< QPointF > *lineData) const |
| void | removeFillBasePoints (QVector< QPointF > *lineData) const |
| QPointF | lowerFillBasePoint (double lowerKey) const |
| QPointF | upperFillBasePoint (double upperKey) const |
| const QPolygonF | getChannelFillPolygon (const QVector< QPointF > *lineData) const |
| int | findIndexBelowX (const QVector< QPointF > *data, double x) const |
| int | findIndexAboveX (const QVector< QPointF > *data, double x) const |
| int | findIndexBelowY (const QVector< QPointF > *data, double y) const |
| int | findIndexAboveY (const QVector< QPointF > *data, double y) const |
| double | pointDistance (const QPointF &pixelPoint) const |
| Protected Member Functions inherited from QCPAbstractPlottable1D< QCPGraphData > | |
| void | getDataSegments (QList< QCPDataRange > &selectedSegments, QList< QCPDataRange > &unselectedSegments) const |
| void | drawPolyline (QCPPainter *painter, const QVector< QPointF > &lineData) const |
| Protected Member Functions inherited from QCPAbstractPlottable | |
| virtual QRect | clipRect () const |
| virtual QCP::Interaction | selectionCategory () const |
| void | applyDefaultAntialiasingHint (QCPPainter *painter) const |
| virtual void | selectEvent (QMouseEvent *event, bool additive, const QVariant &details, bool *selectionStateChanged) |
| virtual void | deselectEvent (bool *selectionStateChanged) |
| void | applyFillAntialiasingHint (QCPPainter *painter) const |
| void | applyScattersAntialiasingHint (QCPPainter *painter) const |
| virtual QRect | clipRect () const |
| virtual QCP::Interaction | selectionCategory () const |
| void | applyDefaultAntialiasingHint (QCPPainter *painter) const |
| virtual void | selectEvent (QMouseEvent *event, bool additive, const QVariant &details, bool *selectionStateChanged) |
| virtual void | deselectEvent (bool *selectionStateChanged) |
| void | coordsToPixels (double key, double value, double &x, double &y) const |
| const QPointF | coordsToPixels (double key, double value) const |
| void | pixelsToCoords (double x, double y, double &key, double &value) const |
| void | pixelsToCoords (const QPointF &pixelPos, double &key, double &value) const |
| QPen | mainPen () const |
| QBrush | mainBrush () const |
| void | applyFillAntialiasingHint (QCPPainter *painter) const |
| void | applyScattersAntialiasingHint (QCPPainter *painter) const |
| void | applyErrorBarsAntialiasingHint (QCPPainter *painter) const |
| double | distSqrToLine (const QPointF &start, const QPointF &end, const QPointF &point) const |
| Protected Member Functions inherited from QCPLayerable | |
| virtual void | parentPlotInitialized (QCustomPlot *parentPlot) |
| virtual void | mousePressEvent (QMouseEvent *event, const QVariant &details) |
| virtual void | mouseMoveEvent (QMouseEvent *event, const QPointF &startPos) |
| virtual void | mouseReleaseEvent (QMouseEvent *event, const QPointF &startPos) |
| virtual void | mouseDoubleClickEvent (QMouseEvent *event, const QVariant &details) |
| virtual void | wheelEvent (QWheelEvent *event) |
| void | initializeParentPlot (QCustomPlot *parentPlot) |
| void | setParentLayerable (QCPLayerable *parentLayerable) |
| bool | moveToLayer (QCPLayer *layer, bool prepend) |
| void | applyAntialiasingHint (QCPPainter *painter, bool localAntialiased, QCP::AntialiasedElement overrideElement) const |
| virtual void | parentPlotInitialized (QCustomPlot *parentPlot) |
| void | initializeParentPlot (QCustomPlot *parentPlot) |
| void | setParentLayerable (QCPLayerable *parentLayerable) |
| bool | moveToLayer (QCPLayer *layer, bool prepend) |
| void | applyAntialiasingHint (QCPPainter *painter, bool localAntialiased, QCP::AntialiasedElement overrideElement) const |
Protected Attributes | |
| LineStyle | mLineStyle |
| QCPScatterStyle | mScatterStyle |
| int | mScatterSkip |
| QPointer< QCPGraph > | mChannelFillGraph |
| bool | mAdaptiveSampling |
| QCPDataMap * | mData |
| QPen | mErrorPen |
| ErrorType | mErrorType |
| double | mErrorBarSize |
| bool | mErrorBarSkipSymbol |
| Protected Attributes inherited from QCPAbstractPlottable1D< QCPGraphData > | |
| QSharedPointer< QCPDataContainer< QCPGraphData > > | mDataContainer |
| Protected Attributes inherited from QCPAbstractPlottable | |
| QString | mName |
| bool | mAntialiasedFill |
| bool | mAntialiasedScatters |
| QPen | mPen |
| QBrush | mBrush |
| QPointer< QCPAxis > | mKeyAxis |
| QPointer< QCPAxis > | mValueAxis |
| QCP::SelectionType | mSelectable |
| QCPDataSelection | mSelection |
| QCPSelectionDecorator * | mSelectionDecorator |
| bool | mAntialiasedErrorBars |
| QPen | mSelectedPen |
| QBrush | mSelectedBrush |
| bool | mSelectable |
| bool | mSelected |
| Protected Attributes inherited from QCPLayerable | |
| bool | mVisible |
| QCustomPlot * | mParentPlot |
| QPointer< QCPLayerable > | mParentLayerable |
| QCPLayer * | mLayer |
| bool | mAntialiased |
Additional Inherited Members | |
| Signals inherited from QCPAbstractPlottable | |
| void | selectionChanged (bool selected) |
| void | selectionChanged (const QCPDataSelection &selection) |
| void | selectableChanged (QCP::SelectionType selectable) |
| void | selectionChanged (bool selected) |
| void | selectableChanged (bool selectable) |
| Signals inherited from QCPLayerable | |
| void | layerChanged (QCPLayer *newLayer) |
| void | layerChanged (QCPLayer *newLayer) |
| Protected Types inherited from QCPAbstractPlottable | |
| enum | SignDomain { sdNegative , sdBoth , sdPositive } |
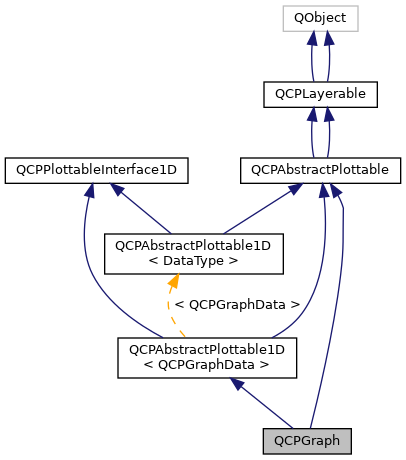
A plottable representing a graph in a plot.

Usually you create new graphs by calling QCustomPlot::addGraph. The resulting instance can be accessed via QCustomPlot::graph.
To plot data, assign it with the setData or addData functions. Alternatively, you can also access and modify the data via the data method, which returns a pointer to the internal QCPGraphDataContainer.
Graphs are used to display single-valued data. Single-valued means that there should only be one data point per unique key coordinate. In other words, the graph can't have loops. If you do want to plot non-single-valued curves, rather use the QCPCurve plottable.
Gaps in the graph line can be created by adding data points with NaN as value (qQNaN() or std::numeric_limits<double>::quiet_NaN()) in between the two data points that shall be separated.
The appearance of the graph is mainly determined by the line style, scatter style, brush and pen of the graph (setLineStyle, setScatterStyle, setBrush, setPen).
QCPGraph knows two types of fills: Normal graph fills towards the zero-value-line parallel to the key axis of the graph, and fills between two graphs, called channel fills. To enable a fill, just set a brush with setBrush which is neither Qt::NoBrush nor fully transparent.
By default, a normal fill towards the zero-value-line will be drawn. To set up a channel fill between this graph and another one, call setChannelFillGraph with the other graph as parameter.
Usually QCustomPlot creates graphs internally via QCustomPlot::addGraph and the resulting instance is accessed via QCustomPlot::graph.
To plot data, assign it with the setData or addData functions. Alternatively, you can also access and modify the graph's data via the data method, which returns a pointer to the internal QCPDataMap.
Graphs are used to display single-valued data. Single-valued means that there should only be one data point per unique key coordinate. In other words, the graph can't have loops. If you do want to plot non-single-valued curves, rather use the QCPCurve plottable.
Gaps in the graph line can be created by adding data points with NaN as value (qQNaN() or std::numeric_limits<double>::quiet_NaN()) in between the two data points that shall be separated.
The appearance of the graph is mainly determined by the line style, scatter style, brush and pen of the graph (setLineStyle, setScatterStyle, setBrush, setPen).
QCPGraph knows two types of fills: Normal graph fills towards the zero-value-line parallel to the key axis of the graph, and fills between two graphs, called channel fills. To enable a fill, just set a brush with setBrush which is neither Qt::NoBrush nor fully transparent.
By default, a normal fill towards the zero-value-line will be drawn. To set up a channel fill between this graph and another one, call setChannelFillGraph with the other graph as parameter.
Definition at line 5996 of file qcustomplot.h.
| enum QCPGraph::ErrorType |
Defines what kind of error bars are drawn for each data point
Definition at line 3018 of file qcustomplot.h.
| enum QCPGraph::LineStyle |
Defines how the graph's line is represented visually in the plot. The line is drawn with the current pen of the graph (setPen).
| Enumerator | |
|---|---|
| lsNone | data points are not connected with any lines (e.g. data only represented with symbols according to the scatter style, see setScatterStyle) |
| lsLine | data points are connected by a straight line |
| lsStepLeft | line is drawn as steps where the step height is the value of the left data point |
| lsStepRight | line is drawn as steps where the step height is the value of the right data point |
| lsStepCenter | line is drawn as steps where the step is in between two data points |
| lsImpulse | each data point is represented by a line parallel to the value axis, which reaches from the data point to the zero-value-line |
Definition at line 6014 of file qcustomplot.h.
| enum QCPGraph::LineStyle |
Defines how the graph's line is represented visually in the plot. The line is drawn with the current pen of the graph (setPen).
| Enumerator | |
|---|---|
| lsNone | data points are not connected with any lines (e.g. data only represented with symbols according to the scatter style, see setScatterStyle) |
| lsLine | data points are connected by a straight line |
| lsStepLeft | line is drawn as steps where the step height is the value of the left data point |
| lsStepRight | line is drawn as steps where the step height is the value of the right data point |
| lsStepCenter | line is drawn as steps where the step is in between two data points |
| lsImpulse | each data point is represented by a line parallel to the value axis, which reaches from the data point to the zero-value-line |
| lsNone | data points are not connected with any lines (e.g. data only represented with symbols according to the scatter style, see setScatterStyle) |
| lsLine | data points are connected by a straight line |
| lsStepLeft | line is drawn as steps where the step height is the value of the left data point |
| lsStepRight | line is drawn as steps where the step height is the value of the right data point |
| lsStepCenter | line is drawn as steps where the step is in between two data points |
| lsImpulse | each data point is represented by a line parallel to the value axis, which reaches from the data point to the zero-value-line |
Definition at line 2994 of file qcustomplot.h.
Constructs a graph which uses keyAxis as its key axis ("x") and valueAxis as its value axis ("y"). keyAxis and valueAxis must reside in the same QCustomPlot instance and not have the same orientation. If either of these restrictions is violated, a corresponding message is printed to the debug output (qDebug), the construction is not aborted, though.
The created QCPGraph is automatically registered with the QCustomPlot instance inferred from keyAxis. This QCustomPlot instance takes ownership of the QCPGraph, so do not delete it manually but use QCustomPlot::removePlottable() instead.
To directly create a graph inside a plot, you can also use the simpler QCustomPlot::addGraph function.
Constructs a graph which uses keyAxis as its key axis ("x") and valueAxis as its value axis ("y"). keyAxis and valueAxis must reside in the same QCustomPlot instance and not have the same orientation. If either of these restrictions is violated, a corresponding message is printed to the debug output (qDebug), the construction is not aborted, though.
The constructed QCPGraph can be added to the plot with QCustomPlot::addPlottable, QCustomPlot then takes ownership of the graph.
To directly create a graph inside a plot, you can also use the simpler QCustomPlot::addGraph function.
Definition at line 20812 of file qcustomplot.cpp.
References ecvColor::blue(), lsLine, QCPLayerable::mParentPlot, QCustomPlot::registerGraph(), setAdaptiveSampling(), QCPAbstractPlottable::setBrush(), setChannelFillGraph(), setLineStyle(), QCPAbstractPlottable::setPen(), and setScatterSkip().
|
virtual |
Definition at line 20826 of file qcustomplot.cpp.
|
virtual |
|
inline |
Definition at line 6047 of file qcustomplot.h.
|
inline |
Definition at line 3043 of file qcustomplot.h.
| void QCPGraph::addData | ( | const QCPData & | data | ) |
This is an overloaded member function, provided for convenience. It differs from the above function only in what argument(s) it accepts. Adds the provided single data point in data to the current data.
Alternatively, you can also access and modify the graph's data via the data method, which returns a pointer to the internal QCPDataMap.
Definition at line 15266 of file qcustomplot.cpp.
References data(), mData, and qtCompatMapInsertMulti().
| void QCPGraph::addData | ( | const QCPDataMap & | dataMap | ) |
Adds the provided data points in dataMap to the current data.
Alternatively, you can also access and modify the graph's data via the data method, which returns a pointer to the internal QCPDataMap.
Definition at line 15254 of file qcustomplot.cpp.
References mData, and qtCompatMapUnite().
| void QCPGraph::addData | ( | const QVector< double > & | keys, |
| const QVector< double > & | values | ||
| ) |
This is an overloaded member function, provided for convenience. It differs from the above function only in what argument(s) it accepts. Adds the provided data points as key and value pairs to the current data.
Alternatively, you can also access and modify the graph's data via the data method, which returns a pointer to the internal QCPDataMap.
Definition at line 15295 of file qcustomplot.cpp.
References QCPData::key, mData, qtCompatMapInsertMulti(), and QCPData::value.
| void QCPGraph::addData | ( | const QVector< double > & | keys, |
| const QVector< double > & | values, | ||
| bool | alreadySorted = false |
||
| ) |
This is an overloaded member function, provided for convenience. It differs from the above function only in what argument(s) it accepts.
Adds the provided points in keys and values to the current data. The provided vectors should have equal length. Else, the number of added points will be the size of the smallest vector.
If you can guarantee that the passed data points are sorted by keys in ascending order, you can set alreadySorted to true, to improve performance by saving a sorting run.
Alternatively, you can also access and modify the data directly via the data method, which returns a pointer to the internal data container.
Definition at line 20982 of file qcustomplot.cpp.
References QCPAbstractPlottable1D< QCPGraphData >::mDataContainer.
Referenced by setData().
| void QCPGraph::addData | ( | double | key, |
| double | value | ||
| ) |
This is an overloaded member function, provided for convenience. It differs from the above function only in what argument(s) it accepts.
Adds the provided data point as key and value to the current data.
Alternatively, you can also access and modify the data directly via the data method, which returns a pointer to the internal data container.
This is an overloaded member function, provided for convenience. It differs from the above function only in what argument(s) it accepts. Adds the provided single data point as key and value pair to the current data.
Alternatively, you can also access and modify the graph's data via the data method, which returns a pointer to the internal QCPDataMap.
Definition at line 21012 of file qcustomplot.cpp.
References QCPAbstractPlottable1D< QCPGraphData >::mDataContainer.
| void QCPGraph::addData | ( | double | key, |
| double | value | ||
| ) |
|
protected |
Definition at line 16631 of file qcustomplot.cpp.
References lowerFillBasePoint(), QCPAbstractPlottable::mKeyAxis, and upperFillBasePoint().
|
inline |
Definition at line 6046 of file qcustomplot.h.
References data().
|
inline |
Definition at line 3042 of file qcustomplot.h.
References data().
|
virtual |
Removes all data points.
Implements QCPAbstractPlottable.
Definition at line 15354 of file qcustomplot.cpp.
References mData.
|
protected |
Definition at line 16602 of file qcustomplot.cpp.
Referenced by getPreparedData().
|
inline |
Returns a shared pointer to the internal data storage of type QCPGraphDataContainer. You may use it to directly manipulate the data, which may be more convenient and faster than using the regular setData or addData methods.
Returns a pointer to the internal data storage of type QCPDataMap. You may use it to directly manipulate the data, which may be more convenient and faster than using the regular setData or addData methods, in certain situations.
Definition at line 6040 of file qcustomplot.h.
Referenced by addData(), channelFillGraph(), WolmanCustomPlot::dataContainer(), dataToImpulseLines(), dataToLines(), dataToStepCenterLines(), dataToStepLeftLines(), dataToStepRightLines(), drawError(), findIndexAboveX(), findIndexAboveY(), findIndexBelowX(), findIndexBelowY(), getScatters(), setData(), and QCPItemTracer::updatePosition().
|
inline |
Definition at line 3035 of file qcustomplot.h.
|
protected |
Definition at line 21522 of file qcustomplot.cpp.
References QCPAxis::coordToPixel(), data(), QCPAbstractPlottable::keyAxis(), QCPAbstractPlottable::mKeyAxis, QCPAbstractPlottable::mValueAxis, QCPAxis::orientation(), result, and QCPAbstractPlottable::valueAxis().
Referenced by getLines().
|
protected |
Definition at line 21318 of file qcustomplot.cpp.
References QCPAxis::coordToPixel(), data(), QCPAbstractPlottable::keyAxis(), QCPAbstractPlottable::mKeyAxis, QCPAbstractPlottable::mValueAxis, QCPAxis::orientation(), result, and QCPAbstractPlottable::valueAxis().
Referenced by getLines().
|
protected |
Definition at line 21458 of file qcustomplot.cpp.
References QCPAxis::coordToPixel(), data(), QCPAbstractPlottable::keyAxis(), QCPAbstractPlottable::mKeyAxis, QCPAbstractPlottable::mValueAxis, QCPAxis::orientation(), result, and QCPAbstractPlottable::valueAxis().
Referenced by getLines().
|
protected |
Definition at line 21358 of file qcustomplot.cpp.
References QCPAxis::coordToPixel(), data(), QCPAbstractPlottable::keyAxis(), QCPAbstractPlottable::mKeyAxis, QCPAbstractPlottable::mValueAxis, QCPAxis::orientation(), result, and QCPAbstractPlottable::valueAxis().
Referenced by getLines().
|
protected |
Definition at line 21408 of file qcustomplot.cpp.
References QCPAxis::coordToPixel(), data(), QCPAbstractPlottable::keyAxis(), QCPAbstractPlottable::mKeyAxis, QCPAbstractPlottable::mValueAxis, QCPAxis::orientation(), result, and QCPAbstractPlottable::valueAxis().
Referenced by getLines().
|
protectedvirtual |
Implements QCPAbstractPlottable.
Definition at line 21060 of file qcustomplot.cpp.
References QCPDataRange::adjusted(), QCPSelectionDecorator::applyBrush(), QCPSelectionDecorator::applyPen(), QCPSelectionDecorator::drawDecoration(), drawFill(), drawImpulsePlot(), drawLinePlot(), drawScatterPlot(), QCPAbstractPlottable1D< QCPGraphData >::getDataSegments(), QCPSelectionDecorator::getFinalScatterStyle(), getLines(), getScatters(), QCP::isInvalidData(), QCPScatterStyle::isNone(), lsImpulse, lsNone, QCPAbstractPlottable::mBrush, QCPAbstractPlottable1D< QCPGraphData >::mDataContainer, QCPAbstractPlottable::mKeyAxis, mLineStyle, QCPAbstractPlottable::mPen, mScatterStyle, QCPAbstractPlottable::mSelectionDecorator, QCPAbstractPlottable::mValueAxis, QCPAbstractPlottable::name(), QCPAbstractPlottable::selection(), and QCPPainter::setPen().
|
protectedvirtual |
Implements QCPAbstractPlottable.
|
protected |
Definition at line 16447 of file qcustomplot.cpp.
References a, QCPAxis::coordToPixel(), data(), QCPPainter::drawLine(), etBoth, etKey, etValue, QCPAbstractPlottable::keyAxis(), mErrorBarSize, mErrorBarSkipSymbol, mErrorType, QCPAbstractPlottable::mKeyAxis, mScatterStyle, QCPAbstractPlottable::mValueAxis, QCPAxis::orientation(), QCPAxis::rangeReversed(), QCPScatterStyle::size(), QCPAbstractPlottable::valueAxis(), x, and y.
Referenced by drawScatterPlot().
|
protectedvirtual |
|
protectedvirtual |
Definition at line 21576 of file qcustomplot.cpp.
References QCPAbstractPlottable::applyFillAntialiasingHint(), getChannelFillPolygon(), getFillPolygon(), getNonNanSegments(), getOverlappingSegments(), QCPAbstractPlottable::keyAxis(), lsImpulse, mChannelFillGraph, and mLineStyle.
Referenced by draw().
|
protectedvirtual |
Definition at line 21650 of file qcustomplot.cpp.
References QCPAbstractPlottable::applyDefaultAntialiasingHint(), and QCPPainter::setPen().
Referenced by draw().
|
protectedvirtual |
Definition at line 16097 of file qcustomplot.cpp.
References QCPAbstractPlottable::applyDefaultAntialiasingHint(), color, QCPAbstractPlottable::mainPen(), QCPAbstractPlottable::pen(), and QCPPainter::setPen().
|
protectedvirtual |
Implements QCPAbstractPlottable.
Definition at line 21144 of file qcustomplot.cpp.
References QCPAbstractPlottable::applyDefaultAntialiasingHint(), QCPAbstractPlottable::applyFillAntialiasingHint(), QCPAbstractPlottable::applyScattersAntialiasingHint(), QCPScatterStyle::applyTo(), QCPPainter::drawLine(), QCPScatterStyle::drawShape(), QCPScatterStyle::isNone(), lsNone, QCPAbstractPlottable::mBrush, mLineStyle, QCPAbstractPlottable::mPen, mScatterStyle, QCPScatterStyle::pixmap(), QCPPainter::setPen(), QCPScatterStyle::setPixmap(), QCPScatterStyle::shape(), and QCPScatterStyle::ssPixmap.
|
protectedvirtual |
Implements QCPAbstractPlottable.
|
protectedvirtual |
Definition at line 21633 of file qcustomplot.cpp.
References QCPAbstractPlottable::applyDefaultAntialiasingHint(), and QCPAbstractPlottable1D< QCPGraphData >::drawPolyline().
Referenced by draw().
|
protectedvirtual |
Definition at line 16015 of file qcustomplot.cpp.
References QCPAbstractPlottable::applyDefaultAntialiasingHint(), color, QCPPainter::drawLine(), QCPAbstractPlottable::mainPen(), QCPPainter::modes(), QCPLayerable::mParentPlot, QCP::phFastPolylines, QCustomPlot::plottingHints(), QCPPainter::pmNoCaching, QCPPainter::pmVectorized, and QCPPainter::setPen().
|
protectedvirtual |
Definition at line 21618 of file qcustomplot.cpp.
References QCPAbstractPlottable::applyScattersAntialiasingHint(), QCPScatterStyle::applyTo(), QCPScatterStyle::drawShape(), and QCPAbstractPlottable::mPen.
Referenced by draw().
|
protectedvirtual |
Definition at line 15958 of file qcustomplot.cpp.
References QCPAbstractPlottable::applyErrorBarsAntialiasingHint(), QCPAbstractPlottable::applyScattersAntialiasingHint(), QCPScatterStyle::applyTo(), QCPAxis::coordToPixel(), drawError(), QCPScatterStyle::drawShape(), etNone, QCPAbstractPlottable::keyAxis(), mErrorPen, mErrorType, QCPAbstractPlottable::mKeyAxis, QCPAbstractPlottable::mPen, mScatterStyle, QCPAbstractPlottable::mValueAxis, QCPAxis::orientation(), QCPPainter::setPen(), and QCPAbstractPlottable::valueAxis().
|
inline |
Definition at line 3040 of file qcustomplot.h.
|
inline |
Definition at line 3041 of file qcustomplot.h.
|
inline |
Definition at line 3039 of file qcustomplot.h.
|
inline |
Definition at line 3038 of file qcustomplot.h.
Referenced by setErrorType().
|
protected |
Definition at line 22553 of file qcustomplot.cpp.
References data(), size, and x.
Referenced by getChannelFillPolygon().
|
protected |
|
protected |
Definition at line 22593 of file qcustomplot.cpp.
References data(), size, and y.
Referenced by getChannelFillPolygon().
|
protected |
|
protected |
Definition at line 22573 of file qcustomplot.cpp.
Referenced by getChannelFillPolygon().
|
protected |
|
protected |
Definition at line 22685 of file qcustomplot.cpp.
Referenced by getChannelFillPolygon().
|
protected |
|
protected |
Definition at line 16800 of file qcustomplot.cpp.
References findIndexAboveX(), findIndexAboveY(), findIndexBelowX(), findIndexBelowY(), QCPAbstractPlottable::keyAxis(), mChannelFillGraph, QCPAbstractPlottable::mKeyAxis, QCPAbstractPlottable::mValueAxis, QCPAxis::orientation(), size, and QCPAbstractPlottable::valueAxis().
|
protected |
Definition at line 22397 of file qcustomplot.cpp.
References QCPDataRange::begin(), copy, QCPDataRange::end(), findIndexAboveX(), findIndexAboveY(), findIndexBelowX(), findIndexBelowY(), QCPAbstractPlottable::keyAxis(), mChannelFillGraph, QCPAbstractPlottable::mKeyAxis, QCPAbstractPlottable::mValueAxis, QCPAxis::orientation(), QCPDataRange::size(), and QCPAbstractPlottable::valueAxis().
Referenced by drawFill().
|
protected |
Definition at line 22299 of file qcustomplot.cpp.
References QCPAxis::atBottom, QCPAxis::atTop, QCPAxis::axisRect(), QCPAxis::axisType(), QCPAxisRect::bottom(), QCPAxis::coordToPixel(), QCPAbstractPlottable::keyAxis(), QCPAxisRect::left(), QCPAbstractPlottable::mKeyAxis, QCPAbstractPlottable::mValueAxis, QCPAxis::orientation(), QCPAxis::range(), QCPAxis::rangeReversed(), result, QCPAxisRect::right(), QCPAxis::scaleType(), QCPAxis::stLinear, QCPAxisRect::top(), QCPRange::upper, and QCPAbstractPlottable::valueAxis().
Referenced by getFillPolygon().
|
protected |
Definition at line 22364 of file qcustomplot.cpp.
References QCPDataRange::begin(), copy, QCPDataRange::end(), getFillBasePoint(), result, and QCPDataRange::size().
Referenced by drawFill().
|
protected |
Definition at line 15864 of file qcustomplot.cpp.
References QCPAxis::coordToPixel(), getPreparedData(), QCPAbstractPlottable::keyAxis(), QCPAbstractPlottable::mKeyAxis, QCPAbstractPlottable::mValueAxis, QCPAxis::orientation(), and QCPAbstractPlottable::valueAxis().
Referenced by getPlotData().
|
virtual |
Returns the coordinate range that all data in this plottable span in the key axis dimension. For logarithmic plots, one can set inSignDomain to either QCP::sdNegative or QCP::sdPositive in order to restrict the returned range to that sign domain. E.g. when only negative range is wanted, set inSignDomain to QCP::sdNegative and all positive points will be ignored for range calculation. For no restriction, just set inSignDomain to QCP::sdBoth (default). foundRange is an output parameter that indicates whether a range could be found or not. If this is false, you shouldn't use the returned range (e.g. no points in data).
Note that foundRange is not the same as QCPRange::validRange, since the range returned by this function may have size zero (e.g. when there is only one data point). In this case foundRange would return true, but the returned range is not a valid range in terms of QCPRange::validRange.
Implements QCPAbstractPlottable.
Definition at line 21047 of file qcustomplot.cpp.
References QCPAbstractPlottable1D< QCPGraphData >::mDataContainer.
Referenced by getKeyRange(), and rescaleKeyAxis().
|
protectedvirtual |
This is an overloaded member function, provided for convenience. It differs from the above function only in what argument(s) it accepts.
Allows to specify whether the error bars should be included in the range calculation.
Definition at line 17148 of file qcustomplot.cpp.
References QCPRange::lower, mData, QCPAbstractPlottable::sdBoth, QCPAbstractPlottable::sdNegative, QCPAbstractPlottable::sdPositive, and QCPRange::upper.
|
protectedvirtual |
Implements QCPAbstractPlottable.
Definition at line 17124 of file qcustomplot.cpp.
References getKeyRange().
|
protected |
Definition at line 15620 of file qcustomplot.cpp.
References QCPAxis::coordToPixel(), getPreparedData(), QCPAbstractPlottable::keyAxis(), QCPAbstractPlottable::mKeyAxis, QCPAbstractPlottable::mValueAxis, QCPAxis::orientation(), and QCPAbstractPlottable::valueAxis().
Referenced by getPlotData().
|
protected |
Definition at line 21205 of file qcustomplot.cpp.
References dataToImpulseLines(), dataToLines(), dataToStepCenterLines(), dataToStepLeftLines(), dataToStepRightLines(), getOptimizedLineData(), getVisibleDataBounds(), lsImpulse, lsLine, lsNone, lsStepCenter, lsStepLeft, lsStepRight, QCPAbstractPlottable::mKeyAxis, and mLineStyle.
Referenced by draw(), and pointDistance().
|
protected |
Definition at line 22124 of file qcustomplot.cpp.
References result, QCPDataRange::setBegin(), and QCPDataRange::setEnd().
Referenced by drawFill().
|
protectedvirtual |
Definition at line 21679 of file qcustomplot.cpp.
References QCPAxis::coordToPixel(), copy, QCPAbstractPlottable1D< QCPGraphData >::dataCount(), QCPAbstractPlottable::keyAxis(), mAdaptiveSampling, QCPAbstractPlottable::mKeyAxis, QCPAbstractPlottable::mValueAxis, QCPAxis::pixelOrientation(), QCPAxis::pixelToCoord(), QCPAxis::scaleType(), QCPAxis::stLogarithmic, and QCPAbstractPlottable::valueAxis().
Referenced by getLines().
|
protectedvirtual |
Definition at line 21841 of file qcustomplot.cpp.
References QCPAxis::coordToPixel(), QCPAbstractPlottable1D< QCPGraphData >::dataCount(), QCPAbstractPlottable::keyAxis(), QCPRange::lower, mAdaptiveSampling, QCPAbstractPlottable1D< QCPGraphData >::mDataContainer, QCPAbstractPlottable::mKeyAxis, mScatterSkip, QCPAbstractPlottable::mValueAxis, QCPAxis::pixelOrientation(), QCPAxis::pixelToCoord(), QCPAxis::range(), QCPAxis::scaleType(), QCPAxis::stLogarithmic, QCPRange::upper, and QCPAbstractPlottable::valueAxis().
Referenced by getScatters().
|
protected |
Definition at line 22186 of file qcustomplot.cpp.
References QCPAbstractPlottable::mKeyAxis, result, and segmentsIntersect().
Referenced by drawFill().
|
protected |
Definition at line 15566 of file qcustomplot.cpp.
References getImpulsePlotData(), getLinePlotData(), getScatterPlotData(), getStepCenterPlotData(), getStepLeftPlotData(), getStepRightPlotData(), lsImpulse, lsLine, lsNone, lsStepCenter, lsStepLeft, lsStepRight, and mLineStyle.
Referenced by pointDistance().
|
protected |
Definition at line 16125 of file qcustomplot.cpp.
References QCPAxis::coordToPixel(), countDataInBounds(), QCPAbstractPlottable1D< QCPGraphData >::dataCount(), getVisibleDataBounds(), QCPAbstractPlottable::keyAxis(), QCPRange::lower, mAdaptiveSampling, mData, QCPAbstractPlottable::mKeyAxis, QCPAbstractPlottable::mValueAxis, QCPAxis::orientation(), QCPAxis::pixelToCoord(), QCPAxis::range(), QCPAxis::rangeReversed(), QCPAxis::scaleType(), QCPAxis::stLogarithmic, QCPRange::upper, and QCPAbstractPlottable::valueAxis().
Referenced by getImpulsePlotData(), getLinePlotData(), getScatterPlotData(), getStepCenterPlotData(), getStepLeftPlotData(), and getStepRightPlotData().
|
protected |
Definition at line 15603 of file qcustomplot.cpp.
References getPreparedData().
Referenced by getPlotData(), and pointDistance().
|
protected |
Definition at line 21261 of file qcustomplot.cpp.
References QCPAxis::coordToPixel(), data(), getOptimizedScatterData(), getVisibleDataBounds(), QCPAbstractPlottable::keyAxis(), QCPAbstractPlottable::mKeyAxis, QCPAbstractPlottable::mValueAxis, QCPAxis::orientation(), and QCPAbstractPlottable::valueAxis().
Referenced by draw().
|
protected |
Definition at line 15793 of file qcustomplot.cpp.
References QCPAxis::coordToPixel(), getPreparedData(), QCPAbstractPlottable::keyAxis(), QCPAbstractPlottable::mKeyAxis, QCPAbstractPlottable::mValueAxis, QCPAxis::orientation(), and QCPAbstractPlottable::valueAxis().
Referenced by getPlotData().
|
protected |
Definition at line 15671 of file qcustomplot.cpp.
References QCPAxis::coordToPixel(), getPreparedData(), QCPAbstractPlottable::keyAxis(), QCPAbstractPlottable::mKeyAxis, QCPAbstractPlottable::mValueAxis, QCPAxis::orientation(), and QCPAbstractPlottable::valueAxis().
Referenced by getPlotData().
|
protected |
Definition at line 15732 of file qcustomplot.cpp.
References QCPAxis::coordToPixel(), getPreparedData(), QCPAbstractPlottable::keyAxis(), QCPAbstractPlottable::mKeyAxis, QCPAbstractPlottable::mValueAxis, QCPAxis::orientation(), and QCPAbstractPlottable::valueAxis().
Referenced by getPlotData().
|
virtual |
Returns the coordinate range that the data points in the specified key range (inKeyRange) span in the value axis dimension. For logarithmic plots, one can set inSignDomain to either QCP::sdNegative or QCP::sdPositive in order to restrict the returned range to that sign domain. E.g. when only negative range is wanted, set inSignDomain to QCP::sdNegative and all positive points will be ignored for range calculation. For no restriction, just set inSignDomain to QCP::sdBoth (default). foundRange is an output parameter that indicates whether a range could be found or not. If this is false, you shouldn't use the returned range (e.g. no points in data).
If inKeyRange has both lower and upper bound set to zero (is equal to QCPRange()), all data points are considered, without any restriction on the keys.
Note that foundRange is not the same as QCPRange::validRange, since the range returned by this function may have size zero (e.g. when there is only one data point). In this case foundRange would return true, but the returned range is not a valid range in terms of QCPRange::validRange.
Implements QCPAbstractPlottable.
Definition at line 21053 of file qcustomplot.cpp.
References QCPAbstractPlottable1D< QCPGraphData >::mDataContainer.
Referenced by getValueRange(), and rescaleValueAxis().
|
protectedvirtual |
This is an overloaded member function, provided for convenience. It differs from the above function only in what argument(s) it accepts.
Allows to specify whether the error bars should be included in the range calculation.
Definition at line 17265 of file qcustomplot.cpp.
References QCPRange::lower, mData, QCPAbstractPlottable::sdBoth, QCPAbstractPlottable::sdNegative, QCPAbstractPlottable::sdPositive, and QCPRange::upper.
|
protectedvirtual |
called by rescaleAxes functions to get the full data value bounds. For logarithmic plots, one can set inSignDomain to either sdNegative or sdPositive in order to restrict the returned range to that sign domain. E.g. when only negative range is wanted, set inSignDomain to sdNegative and all positive points will be ignored for range calculation. For no restriction, just set inSignDomain to sdBoth (default). foundRange is an output parameter that indicates whether a range could be found or not. If this is false, you shouldn't use the returned range (e.g. no points in data).
Note that foundRange is not the same as QCPRange::validRange, since the range returned by this function may have size zero, which wouldn't count as a valid range.
Implements QCPAbstractPlottable.
Definition at line 17133 of file qcustomplot.cpp.
References getValueRange().
|
protected |
Definition at line 16560 of file qcustomplot.cpp.
References mData, and QCPAbstractPlottable::mKeyAxis.
|
protected |
This method outputs the currently visible data range via begin and end. The returned range will also never exceed rangeRestriction.
This method takes into account that the drawing of data lines at the axis rect border always requires the points just outside the visible axis range. So begin and end may actually indicate a range that contains one additional data point to the left and right of the visible axis range.
Definition at line 22087 of file qcustomplot.cpp.
References QCPDataRange::isEmpty(), QCPAbstractPlottable::keyAxis(), QCPRange::lower, QCPAbstractPlottable1D< QCPGraphData >::mDataContainer, QCPAbstractPlottable::mKeyAxis, QCPAbstractPlottable::mValueAxis, QCPAxis::range(), QCPRange::upper, and QCPAbstractPlottable::valueAxis().
Referenced by getLines(), getPreparedData(), and getScatters().
|
inline |
Definition at line 6043 of file qcustomplot.h.
|
inline |
Definition at line 3036 of file qcustomplot.h.
|
protected |
Definition at line 16673 of file qcustomplot.cpp.
References QCPAxis::atBottom, QCPAxis::atLeft, QCPAxis::atRight, QCPAxis::atTop, QCPAxis::axisRect(), QCPAxis::axisType(), QCPAxisRect::bottom(), QCPAxis::coordToPixel(), QCPAbstractPlottable::keyAxis(), QCPAxisRect::left(), QCPAbstractPlottable::mKeyAxis, QCPAbstractPlottable::mValueAxis, QCPAxis::orientation(), QCPAxis::range(), QCPAxis::rangeReversed(), QCPAxisRect::right(), QCPAxis::scaleType(), QCPAxis::stLinear, QCPAxisRect::top(), QCPRange::upper, and QCPAbstractPlottable::valueAxis().
Referenced by addFillBasePoints().
|
protected |
Definition at line 17042 of file qcustomplot.cpp.
References QCPAbstractPlottable::coordsToPixels(), QCPAbstractPlottable::distSqrToLine(), getPlotData(), getScatterPlotData(), QCPScatterStyle::isNone(), lsImpulse, lsNone, mData, mLineStyle, and mScatterStyle.
|
protected |
Definition at line 22619 of file qcustomplot.cpp.
References QCPAbstractPlottable::coordsToPixels(), QCPAbstractPlottable1D< QCPGraphData >::dataCount(), QCPVector2D::distanceSquaredToLine(), getLines(), QCPScatterStyle::isNone(), QCPVector2D::lengthSquared(), lsImpulse, lsNone, QCPAbstractPlottable1D< QCPGraphData >::mDataContainer, mLineStyle, QCPLayerable::mParentPlot, mScatterStyle, QCPAbstractPlottable::pixelsToCoords(), and QCustomPlot::selectionTolerance().
Referenced by selectTest().
| void QCPGraph::removeData | ( | double | fromKey, |
| double | toKey | ||
| ) |
Removes all data points with keys between fromKey and toKey. if fromKey is greater or equal to toKey, the function does nothing. To remove a single data point with known key, use removeData(double key).
Definition at line 15332 of file qcustomplot.cpp.
References mData.
| void QCPGraph::removeData | ( | double | key | ) |
This is an overloaded member function, provided for convenience. It differs from the above function only in what argument(s) it accepts.
Removes a single data point at key. If the position is not known with absolute precision, consider using removeData(double fromKey, double toKey) with a small fuzziness interval around the suspected position, depeding on the precision with which the key is known.
Definition at line 15348 of file qcustomplot.cpp.
References mData.
| void QCPGraph::removeDataAfter | ( | double | key | ) |
Removes all data points with keys greater than key.
Definition at line 15319 of file qcustomplot.cpp.
References mData.
| void QCPGraph::removeDataBefore | ( | double | key | ) |
Removes all data points with keys smaller than key.
Definition at line 15310 of file qcustomplot.cpp.
References mData.
|
protected |
Definition at line 16654 of file qcustomplot.cpp.
| void QCPGraph::rescaleAxes | ( | bool | onlyEnlarge, |
| bool | includeErrorBars | ||
| ) | const |
This is an overloaded member function, provided for convenience. It differs from the above function only in what argument(s) it accepts.
Allows to define whether error bars are taken into consideration when determining the new axis range.
Definition at line 15381 of file qcustomplot.cpp.
References rescaleKeyAxis(), and rescaleValueAxis().
Referenced by cvProbeFilter::apply(), WolmanCustomPlot::rescale(), and WolmanCustomPlot::WolmanCustomPlot().
| void QCPAbstractPlottable::rescaleAxes |
Rescales the key and value axes associated with this plottable to contain all displayed data, so the whole plottable is visible. If the scaling of an axis is logarithmic, rescaleAxes will make sure not to rescale to an illegal range i.e. a range containing different signs and/or zero. Instead it will stay in the current sign domain and ignore all parts of the plottable that lie outside of that domain.
onlyEnlarge makes sure the ranges are only expanded, never reduced. So it's possible to show multiple plottables in their entirety by multiple calls to rescaleAxes where the first call has onlyEnlarge set to false (the default), and all subsequent set to true.
Definition at line 3889 of file qcustomplot.cpp.
| void QCPAbstractPlottable::rescaleAxes |
| void QCPGraph::rescaleKeyAxis | ( | bool | onlyEnlarge, |
| bool | includeErrorBars | ||
| ) | const |
This is an overloaded member function, provided for convenience. It differs from the above function only in what argument(s) it accepts.
Allows to define whether error bars (of kind QCPGraph::etKey) are taken into consideration when determining the new axis range.
Definition at line 15393 of file qcustomplot.cpp.
References getKeyRange(), QCPAbstractPlottable::keyAxis(), QCPRange::lower, mData, QCPAbstractPlottable::mKeyAxis, QCPAxis::range(), QCPAxis::scaleType(), QCPAbstractPlottable::sdBoth, QCPAbstractPlottable::sdNegative, QCPAbstractPlottable::sdPositive, QCPAxis::setRange(), QCPAxis::stLogarithmic, and QCPRange::upper.
| void QCPAbstractPlottable::rescaleKeyAxis |
Rescales the key axis of the plottable so the whole plottable is visible.
See rescaleAxes for detailed behaviour.
Definition at line 3890 of file qcustomplot.cpp.
Referenced by rescaleAxes().
| void QCPAbstractPlottable::rescaleKeyAxis |
| void QCPGraph::rescaleValueAxis | ( | bool | onlyEnlarge, |
| bool | includeErrorBars | ||
| ) | const |
This is an overloaded member function, provided for convenience. It differs from the above function only in what argument(s) it accepts.
Allows to define whether error bars (of kind QCPGraph::etValue) are taken into consideration when determining the new axis range.
Definition at line 15429 of file qcustomplot.cpp.
References getValueRange(), QCPRange::lower, mData, QCPAbstractPlottable::mValueAxis, QCPAxis::range(), QCPAxis::scaleType(), QCPAbstractPlottable::sdBoth, QCPAbstractPlottable::sdNegative, QCPAbstractPlottable::sdPositive, QCPAxis::setRange(), QCPAxis::stLogarithmic, QCPRange::upper, and QCPAbstractPlottable::valueAxis().
| void QCPAbstractPlottable::rescaleValueAxis |
Rescales the value axis of the plottable so the whole plottable is visible.
Returns true if the axis was actually scaled. This might not be the case if this plottable has an invalid range, e.g. because it has no data points.
See rescaleAxes for detailed behaviour.
Definition at line 1738 of file qcustomplot.cpp.
| void QCPAbstractPlottable::rescaleValueAxis |
Rescales the value axis of the plottable so the whole plottable is visible. If inKeyRange is set to true, only the data points which are in the currently visible key axis range are considered.
Returns true if the axis was actually scaled. This might not be the case if this plottable has an invalid range, e.g. because it has no data points.
See rescaleAxes for detailed behaviour.
Definition at line 3891 of file qcustomplot.cpp.
Referenced by rescaleAxes().
|
inline |
Definition at line 6045 of file qcustomplot.h.
|
inline |
Definition at line 6044 of file qcustomplot.h.
|
inline |
Definition at line 3037 of file qcustomplot.h.
|
protected |
Definition at line 22264 of file qcustomplot.cpp.
Referenced by getOverlappingSegments().
|
virtual |
Implements a selectTest specific to this plottable's point geometry.
If details is not 0, it will be set to a QCPDataSelection, describing the closest data point to pos.
\seebaseclassmethod QCPAbstractPlottable::selectTest
Implements QCPAbstractPlottable.
Definition at line 21024 of file qcustomplot.cpp.
References QCPAbstractPlottable1D< QCPGraphData >::mDataContainer, QCPAbstractPlottable::mKeyAxis, QCPAbstractPlottable::mSelectable, QCPAbstractPlottable::mValueAxis, pointDistance(), result, and QCP::stNone.
|
virtual |
This function is used to decide whether a click hits a layerable object or not.
pos is a point in pixel coordinates on the QCustomPlot surface. This function returns the shortest pixel distance of this point to the object. If the object is either invisible or the distance couldn't be determined, -1.0 is returned. Further, if onlySelectable is true and the object is not selectable, -1.0 is returned, too.
If the object is represented not by single lines but by an area like a QCPItemText or the bars of a QCPBars plottable, a click inside the area should also be considered a hit. In these cases this function thus returns a constant value greater zero but still below the parent plot's selection tolerance. (typically the selectionTolerance multiplied by 0.99).
Providing a constant value for area objects allows selecting line objects even when they are obscured by such area objects, by clicking close to the lines (i.e. closer than 0.99*selectionTolerance).
The actual setting of the selection state is not done by this function. This is handled by the parent QCustomPlot when the mouseReleaseEvent occurs, and the finally selected object is notified via the selectEvent/ deselectEvent methods.
details is an optional output parameter. Every layerable subclass may place any information in details. This information will be passed to selectEvent when the parent QCustomPlot decides on the basis of this selectTest call, that the object was successfully selected. The subsequent call to selectEvent will carry the details. This is useful for multi-part objects (like QCPAxis). This way, a possibly complex calculation to decide which part was clicked is only done once in selectTest. The result (i.e. the actually clicked part) can then be placed in details. So in the subsequent selectEvent, the decision which part was selected doesn't have to be done a second time for a single selection operation.
In the case of 1D Plottables (QCPAbstractPlottable1D, like QCPGraph or QCPBars) details will be set to a QCPDataSelection, describing the closest data point to pos.
You may pass 0 as details to indicate that you are not interested in those selection details.
This function is used to decide whether a click hits a layerable object or not.
pos is a point in pixel coordinates on the QCustomPlot surface. This function returns the shortest pixel distance of this point to the object. If the object is either invisible or the distance couldn't be determined, -1.0 is returned. Further, if onlySelectable is true and the object is not selectable, -1.0 is returned, too.
If the object is represented not by single lines but by an area like a QCPItemText or the bars of a QCPBars plottable, a click inside the area should also be considered a hit. In these cases this function thus returns a constant value greater zero but still below the parent plot's selection tolerance. (typically the selectionTolerance multiplied by 0.99).
Providing a constant value for area objects allows selecting line objects even when they are obscured by such area objects, by clicking close to the lines (i.e. closer than 0.99*selectionTolerance).
The actual setting of the selection state is not done by this function. This is handled by the parent QCustomPlot when the mouseReleaseEvent occurs, and the finally selected object is notified via the selectEvent/deselectEvent methods.
details is an optional output parameter. Every layerable subclass may place any information in details. This information will be passed to selectEvent when the parent QCustomPlot decides on the basis of this selectTest call, that the object was successfully selected. The subsequent call to selectEvent will carry the details. This is useful for multi-part objects (like QCPAxis). This way, a possibly complex calculation to decide which part was clicked is only done once in selectTest. The result (i.e. the actually clicked part) can then be placed in details. So in the subsequent selectEvent, the decision which part was selected doesn't have to be done a second time for a single selection operation.
You may pass 0 as details to indicate that you are not interested in those selection details.
Implements QCPAbstractPlottable.
| void QCPGraph::setAdaptiveSampling | ( | bool | enabled | ) |
Sets whether adaptive sampling shall be used when plotting this graph. QCustomPlot's adaptive sampling technique can drastically improve the replot performance for graphs with a larger number of points (e.g. above 10,000), without notably changing the appearance of the graph.
By default, adaptive sampling is enabled. Even if enabled, QCustomPlot decides whether adaptive sampling shall actually be used on a per-graph basis. So leaving adaptive sampling enabled has no disadvantage in almost all cases.

and with adaptive sampling"
As can be seen, line plots experience no visual degradation from adaptive sampling. Outliers are reproduced reliably, as well as the overall shape of the data set. The replot time reduces dramatically though. This allows QCustomPlot to display large amounts of data in realtime.

without and with adaptive sampling"
Care must be taken when using high-density scatter plots in combination with adaptive sampling. The adaptive sampling algorithm treats scatter plots more carefully than line plots which still gives a significant reduction of replot times, but not quite as much as for line plots. This is because scatter plots inherently need more data points to be preserved in order to still resemble the original, non-adaptive-sampling plot. As shown above, the results still aren't quite identical, as banding occurs for the outer data points. This is in fact intentional, such that the boundaries of the data cloud stay visible to the viewer. How strong the banding appears, depends on the point density, i.e. the number of points in the plot.
For some situations with scatter plots it might thus be desirable to manually turn adaptive sampling off. For example, when saving the plot to disk. This can be achieved by setting enabled to false before issuing a command like QCustomPlot::savePng, and setting enabled back to true afterwards.
Definition at line 20965 of file qcustomplot.cpp.
References mAdaptiveSampling.
Referenced by QCPGraph().
| void QCPGraph::setAdaptiveSampling | ( | bool | enabled | ) |
| void QCPGraph::setChannelFillGraph | ( | QCPGraph * | targetGraph | ) |
Sets the target graph for filling the area between this graph and targetGraph with the current brush (setBrush).
When targetGraph is set to 0, a normal graph fill to the zero-value-line will be shown. To disable any filling, set the brush to Qt::NoBrush.
Definition at line 20911 of file qcustomplot.cpp.
References mChannelFillGraph, and QCPLayerable::mParentPlot.
Referenced by QCPGraph().
| void QCPGraph::setChannelFillGraph | ( | QCPGraph * | targetGraph | ) |
| void QCPGraph::setData | ( | const QVector< double > & | key, |
| const QVector< double > & | value | ||
| ) |
This is an overloaded member function, provided for convenience. It differs from the above function only in what argument(s) it accepts.
Replaces the current data with the provided points in key and value pairs. The provided vectors should have equal length. Else, the number of added points will be the size of the smallest vector.
Definition at line 14931 of file qcustomplot.cpp.
References QCPData::key, mData, qtCompatMapInsertMulti(), and QCPData::value.
| void QCPGraph::setData | ( | const QVector< double > & | keys, |
| const QVector< double > & | values, | ||
| bool | alreadySorted = false |
||
| ) |
This is an overloaded member function, provided for convenience. It differs from the above function only in what argument(s) it accepts.
Replaces the current data with the provided points in keys and values. The provided vectors should have equal length. Else, the number of added points will be the size of the smallest vector.
If you can guarantee that the passed data points are sorted by keys in ascending order, you can set alreadySorted to true, to improve performance by saving a sorting run.
Definition at line 20861 of file qcustomplot.cpp.
References addData(), and QCPAbstractPlottable1D< QCPGraphData >::mDataContainer.
| void QCPGraph::setData | ( | QCPDataMap * | data, |
| bool | copy = false |
||
| ) |
Replaces the current data with the provided data.
If copy is set to true, data points in data will only be copied. if false, the graph takes ownership of the passed data and replaces the internal data pointer with it. This is significantly faster than copying for large datasets.
Alternatively, you can also access and modify the graph's data via the data method, which returns a pointer to the internal QCPDataMap.
Definition at line 14909 of file qcustomplot.cpp.
| void QCPGraph::setData | ( | QSharedPointer< QCPGraphDataContainer > | data | ) |
This is an overloaded member function, provided for convenience. It differs from the above function only in what argument(s) it accepts.
Replaces the current data container with the provided data container.
Since a QSharedPointer is used, multiple QCPGraphs may share the same data container safely. Modifying the data in the container will then affect all graphs that share the container. Sharing can be achieved by simply exchanging the data containers wrapped in shared pointers:
If you do not wish to share containers, but create a copy from an existing container, rather use the QCPDataContainer<DataType>::set method on the graph's data container directly:
Definition at line 20845 of file qcustomplot.cpp.
References data(), and QCPAbstractPlottable1D< QCPGraphData >::mDataContainer.
Referenced by cvProbeFilter::apply(), ccHistogramWindow::refresh(), ccWaveWidget::refresh(), and WolmanCustomPlot::WolmanCustomPlot().
| void QCPGraph::setDataBothError | ( | const QVector< double > & | key, |
| const QVector< double > & | value, | ||
| const QVector< double > & | keyError, | ||
| const QVector< double > & | valueError | ||
| ) |
Replaces the current data with the provided points in key and value pairs. Additionally the symmetrical key and value errors of the data points are set to the values in keyError and valueError. For error bars to show appropriately, see setErrorType. The provided vectors should have equal length. Else, the number of added points will be the size of the smallest vector.
For asymmetrical errors (plus different from minus), see the overloaded version of this function.
Definition at line 15065 of file qcustomplot.cpp.
References QCPData::key, QCPData::keyErrorMinus, QCPData::keyErrorPlus, mData, qtCompatMapInsertMulti(), QCPData::value, QCPData::valueErrorMinus, and QCPData::valueErrorPlus.
| void QCPGraph::setDataBothError | ( | const QVector< double > & | key, |
| const QVector< double > & | value, | ||
| const QVector< double > & | keyErrorMinus, | ||
| const QVector< double > & | keyErrorPlus, | ||
| const QVector< double > & | valueErrorMinus, | ||
| const QVector< double > & | valueErrorPlus | ||
| ) |
This is an overloaded member function, provided for convenience. It differs from the above function only in what argument(s) it accepts. Replaces the current data with the provided points in key and value pairs. Additionally the negative key and value errors of the data points are set to the values in keyErrorMinus and valueErrorMinus. The positive key and value errors are set to the values in keyErrorPlus valueErrorPlus. For error bars to show appropriately, see setErrorType. The provided vectors should have equal length. Else, the number of added points will be the size of the smallest vector.
Definition at line 15096 of file qcustomplot.cpp.
References QCPData::key, QCPData::keyErrorMinus, QCPData::keyErrorPlus, mData, qtCompatMapInsertMulti(), QCPData::value, QCPData::valueErrorMinus, and QCPData::valueErrorPlus.
| void QCPGraph::setDataKeyError | ( | const QVector< double > & | key, |
| const QVector< double > & | value, | ||
| const QVector< double > & | keyError | ||
| ) |
Replaces the current data with the provided points in key and value pairs. Additionally the symmetrical key error of the data points are set to the values in keyError. For error bars to show appropriately, see setErrorType. The provided vectors should have equal length. Else, the number of added points will be the size of the smallest vector.
For asymmetrical errors (plus different from minus), see the overloaded version of this function.
Definition at line 15009 of file qcustomplot.cpp.
References QCPData::key, QCPData::keyErrorMinus, QCPData::keyErrorPlus, mData, qtCompatMapInsertMulti(), and QCPData::value.
| void QCPGraph::setDataKeyError | ( | const QVector< double > & | key, |
| const QVector< double > & | value, | ||
| const QVector< double > & | keyErrorMinus, | ||
| const QVector< double > & | keyErrorPlus | ||
| ) |
This is an overloaded member function, provided for convenience. It differs from the above function only in what argument(s) it accepts. Replaces the current data with the provided points in key and value pairs. Additionally the negative key error of the data points are set to the values in keyErrorMinus, the positive key error to keyErrorPlus. For error bars to show appropriately, see setErrorType. The provided vectors should have equal length. Else, the number of added points will be the size of the smallest vector.
Definition at line 15035 of file qcustomplot.cpp.
References QCPData::key, QCPData::keyErrorMinus, QCPData::keyErrorPlus, mData, qtCompatMapInsertMulti(), and QCPData::value.
| void QCPGraph::setDataValueError | ( | const QVector< double > & | key, |
| const QVector< double > & | value, | ||
| const QVector< double > & | valueError | ||
| ) |
Replaces the current data with the provided points in key and value pairs. Additionally the symmetrical value error of the data points are set to the values in valueError. For error bars to show appropriately, see setErrorType. The provided vectors should have equal length. Else, the number of added points will be the size of the smallest vector.
For asymmetrical errors (plus different from minus), see the overloaded version of this function.
Definition at line 14954 of file qcustomplot.cpp.
References QCPData::key, mData, qtCompatMapInsertMulti(), QCPData::value, QCPData::valueErrorMinus, and QCPData::valueErrorPlus.
| void QCPGraph::setDataValueError | ( | const QVector< double > & | key, |
| const QVector< double > & | value, | ||
| const QVector< double > & | valueErrorMinus, | ||
| const QVector< double > & | valueErrorPlus | ||
| ) |
This is an overloaded member function, provided for convenience. It differs from the above function only in what argument(s) it accepts. Replaces the current data with the provided points in key and value pairs. Additionally the negative value error of the data points are set to the values in valueErrorMinus, the positive value error to valueErrorPlus. For error bars to show appropriately, see setErrorType. The provided vectors should have equal length. Else, the number of added points will be the size of the smallest vector.
Definition at line 14980 of file qcustomplot.cpp.
References QCPData::key, mData, qtCompatMapInsertMulti(), QCPData::value, QCPData::valueErrorMinus, and QCPData::valueErrorPlus.
| void QCPGraph::setErrorBarSize | ( | double | size | ) |
Sets the width of the handles at both ends of an error bar in pixels.
Definition at line 15161 of file qcustomplot.cpp.
References mErrorBarSize, and size.
| void QCPGraph::setErrorBarSkipSymbol | ( | bool | enabled | ) |
If enabled is set to true, the error bar will not be drawn as a solid line under the scatter symbol but leave some free space around the symbol.
This feature uses the current scatter size (QCPScatterStyle::setSize) to determine the size of the area to leave blank. So when drawing Pixmaps as scatter points (QCPScatterStyle::ssPixmap), the scatter size must be set manually to a value corresponding to the size of the Pixmap, if the error bars should leave gaps to its boundaries.
setErrorType, setErrorBarSize, setScatterStyle
Definition at line 15175 of file qcustomplot.cpp.
References mErrorBarSkipSymbol.
| void QCPGraph::setErrorPen | ( | const QPen & | pen | ) |
Sets the pen with which the error bars will be drawn.
Definition at line 15156 of file qcustomplot.cpp.
References mErrorPen, and QCPAbstractPlottable::pen().
| void QCPGraph::setErrorType | ( | ErrorType | errorType | ) |
Sets which kind of error bars (Key Error, Value Error or both) should be drawn on each data point. If you set errorType to something other than etNone, make sure to actually pass error data via the specific setData functions along with the data points (e.g. setDataValueError, setDataKeyError, setDataBothError).
Definition at line 15150 of file qcustomplot.cpp.
References errorType(), and mErrorType.
| void QCPGraph::setLineStyle | ( | LineStyle | ls | ) |
Sets how the single data points are connected in the plot. For scatter-only plots, set ls to lsNone and setScatterStyle to the desired scatter style.
Definition at line 20875 of file qcustomplot.cpp.
References mLineStyle.
Referenced by QCPGraph(), and WolmanCustomPlot::WolmanCustomPlot().
| void QCPGraph::setLineStyle | ( | LineStyle | ls | ) |
| void QCPGraph::setScatterSkip | ( | int | skip | ) |
If scatters are displayed (scatter style not QCPScatterStyle::ssNone), skip number of scatter points are skipped/not drawn after every drawn scatter point.
This can be used to make the data appear sparser while for example still having a smooth line, and to improve performance for very high density plots.
If skip is set to 0 (default), all scatter points are drawn.
Definition at line 20900 of file qcustomplot.cpp.
References mScatterSkip.
Referenced by QCPGraph().
| void QCPGraph::setScatterStyle | ( | const QCPScatterStyle & | style | ) |
Sets the visual appearance of single data points in the plot. If set to QCPScatterStyle::ssNone, no scatter points are drawn (e.g. for line-only-plots with appropriate line style).
Definition at line 20884 of file qcustomplot.cpp.
References mScatterStyle.
Referenced by WolmanCustomPlot::WolmanCustomPlot().
| void QCPGraph::setScatterStyle | ( | const QCPScatterStyle & | style | ) |
|
protected |
Definition at line 16739 of file qcustomplot.cpp.
References QCPAxis::atBottom, QCPAxis::atLeft, QCPAxis::atRight, QCPAxis::atTop, QCPAxis::axisRect(), QCPAxis::axisType(), QCPAxisRect::bottom(), QCPAxis::coordToPixel(), QCPAbstractPlottable::keyAxis(), QCPAxisRect::left(), QCPAbstractPlottable::mKeyAxis, QCPAbstractPlottable::mValueAxis, QCPAxis::orientation(), QCPAxis::range(), QCPAxis::rangeReversed(), QCPAxisRect::right(), QCPAxis::scaleType(), QCPAxis::stLinear, QCPAxisRect::top(), QCPRange::upper, and QCPAbstractPlottable::valueAxis().
Referenced by addFillBasePoints().
|
protected |
Definition at line 6084 of file qcustomplot.h.
Referenced by getOptimizedLineData(), getOptimizedScatterData(), getPreparedData(), and setAdaptiveSampling().
|
protected |
Definition at line 6083 of file qcustomplot.h.
Referenced by drawFill(), getChannelFillPolygon(), and setChannelFillGraph().
|
protected |
Definition at line 3108 of file qcustomplot.h.
Referenced by addData(), clearData(), countDataInBounds(), getKeyRange(), getPreparedData(), getValueRange(), getVisibleDataBounds(), pointDistance(), removeData(), removeDataAfter(), removeDataBefore(), rescaleKeyAxis(), rescaleValueAxis(), setData(), setDataBothError(), setDataKeyError(), and setDataValueError().
|
protected |
Definition at line 3113 of file qcustomplot.h.
Referenced by drawError(), and setErrorBarSize().
|
protected |
Definition at line 3114 of file qcustomplot.h.
Referenced by drawError(), and setErrorBarSkipSymbol().
|
protected |
Definition at line 3109 of file qcustomplot.h.
Referenced by drawScatterPlot(), and setErrorPen().
|
protected |
Definition at line 3112 of file qcustomplot.h.
Referenced by drawError(), drawScatterPlot(), and setErrorType().
|
protected |
Definition at line 6080 of file qcustomplot.h.
Referenced by draw(), drawFill(), drawLegendIcon(), getLines(), getPlotData(), pointDistance(), and setLineStyle().
|
protected |
Definition at line 6082 of file qcustomplot.h.
Referenced by getOptimizedScatterData(), and setScatterSkip().
|
protected |
Definition at line 6081 of file qcustomplot.h.
Referenced by draw(), drawError(), drawLegendIcon(), drawScatterPlot(), pointDistance(), and setScatterStyle().