|
ACloudViewer
3.9.4
A Modern Library for 3D Data Processing
|
|
ACloudViewer
3.9.4
A Modern Library for 3D Data Processing
|
A plottable representing a single statistical box in a plot. More...
#include <qcustomplot.h>
Public Member Functions | |
| QCPStatisticalBox (QCPAxis *keyAxis, QCPAxis *valueAxis) | |
| QSharedPointer< QCPStatisticalBoxDataContainer > | data () const |
| double | width () const |
| double | whiskerWidth () const |
| QPen | whiskerPen () const |
| QPen | whiskerBarPen () const |
| bool | whiskerAntialiased () const |
| QPen | medianPen () const |
| QCPScatterStyle | outlierStyle () const |
| void | setData (QSharedPointer< QCPStatisticalBoxDataContainer > data) |
| void | setData (const QVector< double > &keys, const QVector< double > &minimum, const QVector< double > &lowerQuartile, const QVector< double > &median, const QVector< double > &upperQuartile, const QVector< double > &maximum, bool alreadySorted=false) |
| void | setWidth (double width) |
| void | setWhiskerWidth (double width) |
| void | setWhiskerPen (const QPen &pen) |
| void | setWhiskerBarPen (const QPen &pen) |
| void | setWhiskerAntialiased (bool enabled) |
| void | setMedianPen (const QPen &pen) |
| void | setOutlierStyle (const QCPScatterStyle &style) |
| void | addData (const QVector< double > &keys, const QVector< double > &minimum, const QVector< double > &lowerQuartile, const QVector< double > &median, const QVector< double > &upperQuartile, const QVector< double > &maximum, bool alreadySorted=false) |
| void | addData (double key, double minimum, double lowerQuartile, double median, double upperQuartile, double maximum, const QVector< double > &outliers=QVector< double >()) |
| virtual QCPDataSelection | selectTestRect (const QRectF &rect, bool onlySelectable) const |
| virtual double | selectTest (const QPointF &pos, bool onlySelectable, QVariant *details=0) const |
| virtual QCPRange | getKeyRange (bool &foundRange, QCP::SignDomain inSignDomain=QCP::sdBoth) const |
| virtual QCPRange | getValueRange (bool &foundRange, QCP::SignDomain inSignDomain=QCP::sdBoth, const QCPRange &inKeyRange=QCPRange()) const |
| QCPStatisticalBox (QCPAxis *keyAxis, QCPAxis *valueAxis) | |
| double | key () const |
| double | minimum () const |
| double | lowerQuartile () const |
| double | median () const |
| double | upperQuartile () const |
| double | maximum () const |
| QVector< double > | outliers () const |
| double | width () const |
| double | whiskerWidth () const |
| QPen | whiskerPen () const |
| QPen | whiskerBarPen () const |
| QPen | medianPen () const |
| QCPScatterStyle | outlierStyle () const |
| void | setKey (double key) |
| void | setMinimum (double value) |
| void | setLowerQuartile (double value) |
| void | setMedian (double value) |
| void | setUpperQuartile (double value) |
| void | setMaximum (double value) |
| void | setOutliers (const QVector< double > &values) |
| void | setData (double key, double minimum, double lowerQuartile, double median, double upperQuartile, double maximum) |
| void | setWidth (double width) |
| void | setWhiskerWidth (double width) |
| void | setWhiskerPen (const QPen &pen) |
| void | setWhiskerBarPen (const QPen &pen) |
| void | setMedianPen (const QPen &pen) |
| void | setOutlierStyle (const QCPScatterStyle &style) |
| virtual void | clearData () |
| virtual double | selectTest (const QPointF &pos, bool onlySelectable, QVariant *details=0) const |
 Public Member Functions inherited from QCPAbstractPlottable1D< QCPStatisticalBoxData > Public Member Functions inherited from QCPAbstractPlottable1D< QCPStatisticalBoxData > | |
| QCPAbstractPlottable1D (QCPAxis *keyAxis, QCPAxis *valueAxis) | |
| virtual | ~QCPAbstractPlottable1D () |
| virtual int | dataCount () const |
| virtual double | dataMainKey (int index) const |
| virtual double | dataSortKey (int index) const |
| virtual double | dataMainValue (int index) const |
| virtual QCPRange | dataValueRange (int index) const |
| virtual QPointF | dataPixelPosition (int index) const |
| virtual bool | sortKeyIsMainKey () const |
| virtual int | findBegin (double sortKey, bool expandedRange=true) const |
| virtual int | findEnd (double sortKey, bool expandedRange=true) const |
| virtual QCPPlottableInterface1D * | interface1D () |
| Public Member Functions inherited from QCPAbstractPlottable | |
| QCPAbstractPlottable (QCPAxis *keyAxis, QCPAxis *valueAxis) | |
| virtual | ~QCPAbstractPlottable () |
| QString | name () const |
| bool | antialiasedFill () const |
| bool | antialiasedScatters () const |
| QPen | pen () const |
| QBrush | brush () const |
| QCPAxis * | keyAxis () const |
| QCPAxis * | valueAxis () const |
| QCP::SelectionType | selectable () const |
| bool | selected () const |
| QCPDataSelection | selection () const |
| QCPSelectionDecorator * | selectionDecorator () const |
| void | setName (const QString &name) |
| void | setAntialiasedFill (bool enabled) |
| void | setAntialiasedScatters (bool enabled) |
| void | setPen (const QPen &pen) |
| void | setBrush (const QBrush &brush) |
| void | setKeyAxis (QCPAxis *axis) |
| void | setValueAxis (QCPAxis *axis) |
| Q_SLOT void | setSelectable (QCP::SelectionType selectable) |
| Q_SLOT void | setSelection (QCPDataSelection selection) |
| void | setSelectionDecorator (QCPSelectionDecorator *decorator) |
| void | coordsToPixels (double key, double value, double &x, double &y) const |
| const QPointF | coordsToPixels (double key, double value) const |
| void | pixelsToCoords (double x, double y, double &key, double &value) const |
| void | pixelsToCoords (const QPointF &pixelPos, double &key, double &value) const |
| void | rescaleAxes (bool onlyEnlarge=false) const |
| void | rescaleKeyAxis (bool onlyEnlarge=false) const |
| void | rescaleValueAxis (bool onlyEnlarge=false, bool inKeyRange=false) const |
| bool | addToLegend (QCPLegend *legend) |
| bool | addToLegend () |
| bool | removeFromLegend (QCPLegend *legend) const |
| bool | removeFromLegend () const |
| QCPAbstractPlottable (QCPAxis *keyAxis, QCPAxis *valueAxis) | |
| QString | name () const |
| bool | antialiasedFill () const |
| bool | antialiasedScatters () const |
| bool | antialiasedErrorBars () const |
| QPen | pen () const |
| QPen | selectedPen () const |
| QBrush | brush () const |
| QBrush | selectedBrush () const |
| QCPAxis * | keyAxis () const |
| QCPAxis * | valueAxis () const |
| bool | selectable () const |
| bool | selected () const |
| void | setName (const QString &name) |
| void | setAntialiasedFill (bool enabled) |
| void | setAntialiasedScatters (bool enabled) |
| void | setAntialiasedErrorBars (bool enabled) |
| void | setPen (const QPen &pen) |
| void | setSelectedPen (const QPen &pen) |
| void | setBrush (const QBrush &brush) |
| void | setSelectedBrush (const QBrush &brush) |
| void | setKeyAxis (QCPAxis *axis) |
| void | setValueAxis (QCPAxis *axis) |
| Q_SLOT void | setSelectable (bool selectable) |
| Q_SLOT void | setSelected (bool selected) |
| virtual bool | addToLegend () |
| virtual bool | removeFromLegend () const |
| void | rescaleAxes (bool onlyEnlarge=false) const |
| void | rescaleKeyAxis (bool onlyEnlarge=false) const |
| void | rescaleValueAxis (bool onlyEnlarge=false) const |
| Public Member Functions inherited from QCPLayerable | |
| QCPLayerable (QCustomPlot *plot, QString targetLayer=QString(), QCPLayerable *parentLayerable=0) | |
| virtual | ~QCPLayerable () |
| bool | visible () const |
| QCustomPlot * | parentPlot () const |
| QCPLayerable * | parentLayerable () const |
| QCPLayer * | layer () const |
| bool | antialiased () const |
| void | setVisible (bool on) |
| Q_SLOT bool | setLayer (QCPLayer *layer) |
| bool | setLayer (const QString &layerName) |
| void | setAntialiased (bool enabled) |
| bool | realVisibility () const |
| QCPLayerable (QCustomPlot *plot, QString targetLayer=QString(), QCPLayerable *parentLayerable=0) | |
| ~QCPLayerable () | |
| bool | visible () const |
| QCustomPlot * | parentPlot () const |
| QCPLayerable * | parentLayerable () const |
| QCPLayer * | layer () const |
| bool | antialiased () const |
| void | setVisible (bool on) |
| Q_SLOT bool | setLayer (QCPLayer *layer) |
| bool | setLayer (const QString &layerName) |
| void | setAntialiased (bool enabled) |
| bool | realVisibility () const |
| Public Member Functions inherited from QCPPlottableInterface1D | |
| virtual | ~QCPPlottableInterface1D () |
Protected Member Functions | |
| virtual void | draw (QCPPainter *painter) |
| virtual void | drawLegendIcon (QCPPainter *painter, const QRectF &rect) const |
| virtual void | drawStatisticalBox (QCPPainter *painter, QCPStatisticalBoxDataContainer::const_iterator it, const QCPScatterStyle &outlierStyle) const |
| void | getVisibleDataBounds (QCPStatisticalBoxDataContainer::const_iterator &begin, QCPStatisticalBoxDataContainer::const_iterator &end) const |
| QRectF | getQuartileBox (QCPStatisticalBoxDataContainer::const_iterator it) const |
| QVector< QLineF > | getWhiskerBackboneLines (QCPStatisticalBoxDataContainer::const_iterator it) const |
| QVector< QLineF > | getWhiskerBarLines (QCPStatisticalBoxDataContainer::const_iterator it) const |
| virtual void | draw (QCPPainter *painter) |
| virtual void | drawLegendIcon (QCPPainter *painter, const QRectF &rect) const |
| virtual QCPRange | getKeyRange (bool &foundRange, SignDomain inSignDomain=sdBoth) const |
| virtual QCPRange | getValueRange (bool &foundRange, SignDomain inSignDomain=sdBoth) const |
| virtual void | drawQuartileBox (QCPPainter *painter, QRectF *quartileBox=0) const |
| virtual void | drawMedian (QCPPainter *painter) const |
| virtual void | drawWhiskers (QCPPainter *painter) const |
| virtual void | drawOutliers (QCPPainter *painter) const |
| Protected Member Functions inherited from QCPAbstractPlottable1D< QCPStatisticalBoxData > | |
| void | getDataSegments (QList< QCPDataRange > &selectedSegments, QList< QCPDataRange > &unselectedSegments) const |
| void | drawPolyline (QCPPainter *painter, const QVector< QPointF > &lineData) const |
| Protected Member Functions inherited from QCPAbstractPlottable | |
| virtual QRect | clipRect () const |
| virtual QCP::Interaction | selectionCategory () const |
| void | applyDefaultAntialiasingHint (QCPPainter *painter) const |
| virtual void | selectEvent (QMouseEvent *event, bool additive, const QVariant &details, bool *selectionStateChanged) |
| virtual void | deselectEvent (bool *selectionStateChanged) |
| void | applyFillAntialiasingHint (QCPPainter *painter) const |
| void | applyScattersAntialiasingHint (QCPPainter *painter) const |
| virtual QRect | clipRect () const |
| virtual QCP::Interaction | selectionCategory () const |
| void | applyDefaultAntialiasingHint (QCPPainter *painter) const |
| virtual void | selectEvent (QMouseEvent *event, bool additive, const QVariant &details, bool *selectionStateChanged) |
| virtual void | deselectEvent (bool *selectionStateChanged) |
| void | coordsToPixels (double key, double value, double &x, double &y) const |
| const QPointF | coordsToPixels (double key, double value) const |
| void | pixelsToCoords (double x, double y, double &key, double &value) const |
| void | pixelsToCoords (const QPointF &pixelPos, double &key, double &value) const |
| QPen | mainPen () const |
| QBrush | mainBrush () const |
| void | applyFillAntialiasingHint (QCPPainter *painter) const |
| void | applyScattersAntialiasingHint (QCPPainter *painter) const |
| void | applyErrorBarsAntialiasingHint (QCPPainter *painter) const |
| double | distSqrToLine (const QPointF &start, const QPointF &end, const QPointF &point) const |
| Protected Member Functions inherited from QCPLayerable | |
| virtual void | parentPlotInitialized (QCustomPlot *parentPlot) |
| virtual void | mousePressEvent (QMouseEvent *event, const QVariant &details) |
| virtual void | mouseMoveEvent (QMouseEvent *event, const QPointF &startPos) |
| virtual void | mouseReleaseEvent (QMouseEvent *event, const QPointF &startPos) |
| virtual void | mouseDoubleClickEvent (QMouseEvent *event, const QVariant &details) |
| virtual void | wheelEvent (QWheelEvent *event) |
| void | initializeParentPlot (QCustomPlot *parentPlot) |
| void | setParentLayerable (QCPLayerable *parentLayerable) |
| bool | moveToLayer (QCPLayer *layer, bool prepend) |
| void | applyAntialiasingHint (QCPPainter *painter, bool localAntialiased, QCP::AntialiasedElement overrideElement) const |
| virtual void | parentPlotInitialized (QCustomPlot *parentPlot) |
| void | initializeParentPlot (QCustomPlot *parentPlot) |
| void | setParentLayerable (QCPLayerable *parentLayerable) |
| bool | moveToLayer (QCPLayer *layer, bool prepend) |
| void | applyAntialiasingHint (QCPPainter *painter, bool localAntialiased, QCP::AntialiasedElement overrideElement) const |
Additional Inherited Members | |
| Signals inherited from QCPAbstractPlottable | |
| void | selectionChanged (bool selected) |
| void | selectionChanged (const QCPDataSelection &selection) |
| void | selectableChanged (QCP::SelectionType selectable) |
| void | selectionChanged (bool selected) |
| void | selectableChanged (bool selectable) |
| Signals inherited from QCPLayerable | |
| void | layerChanged (QCPLayer *newLayer) |
| void | layerChanged (QCPLayer *newLayer) |
| Protected Types inherited from QCPAbstractPlottable | |
| enum | SignDomain { sdNegative , sdBoth , sdPositive } |
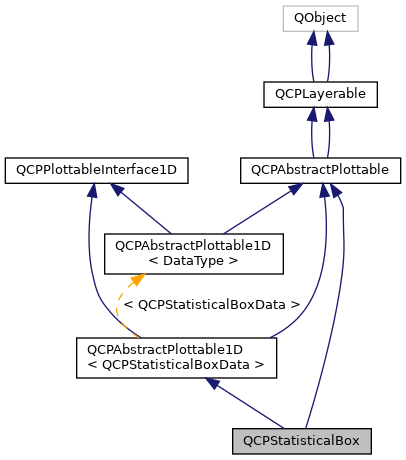
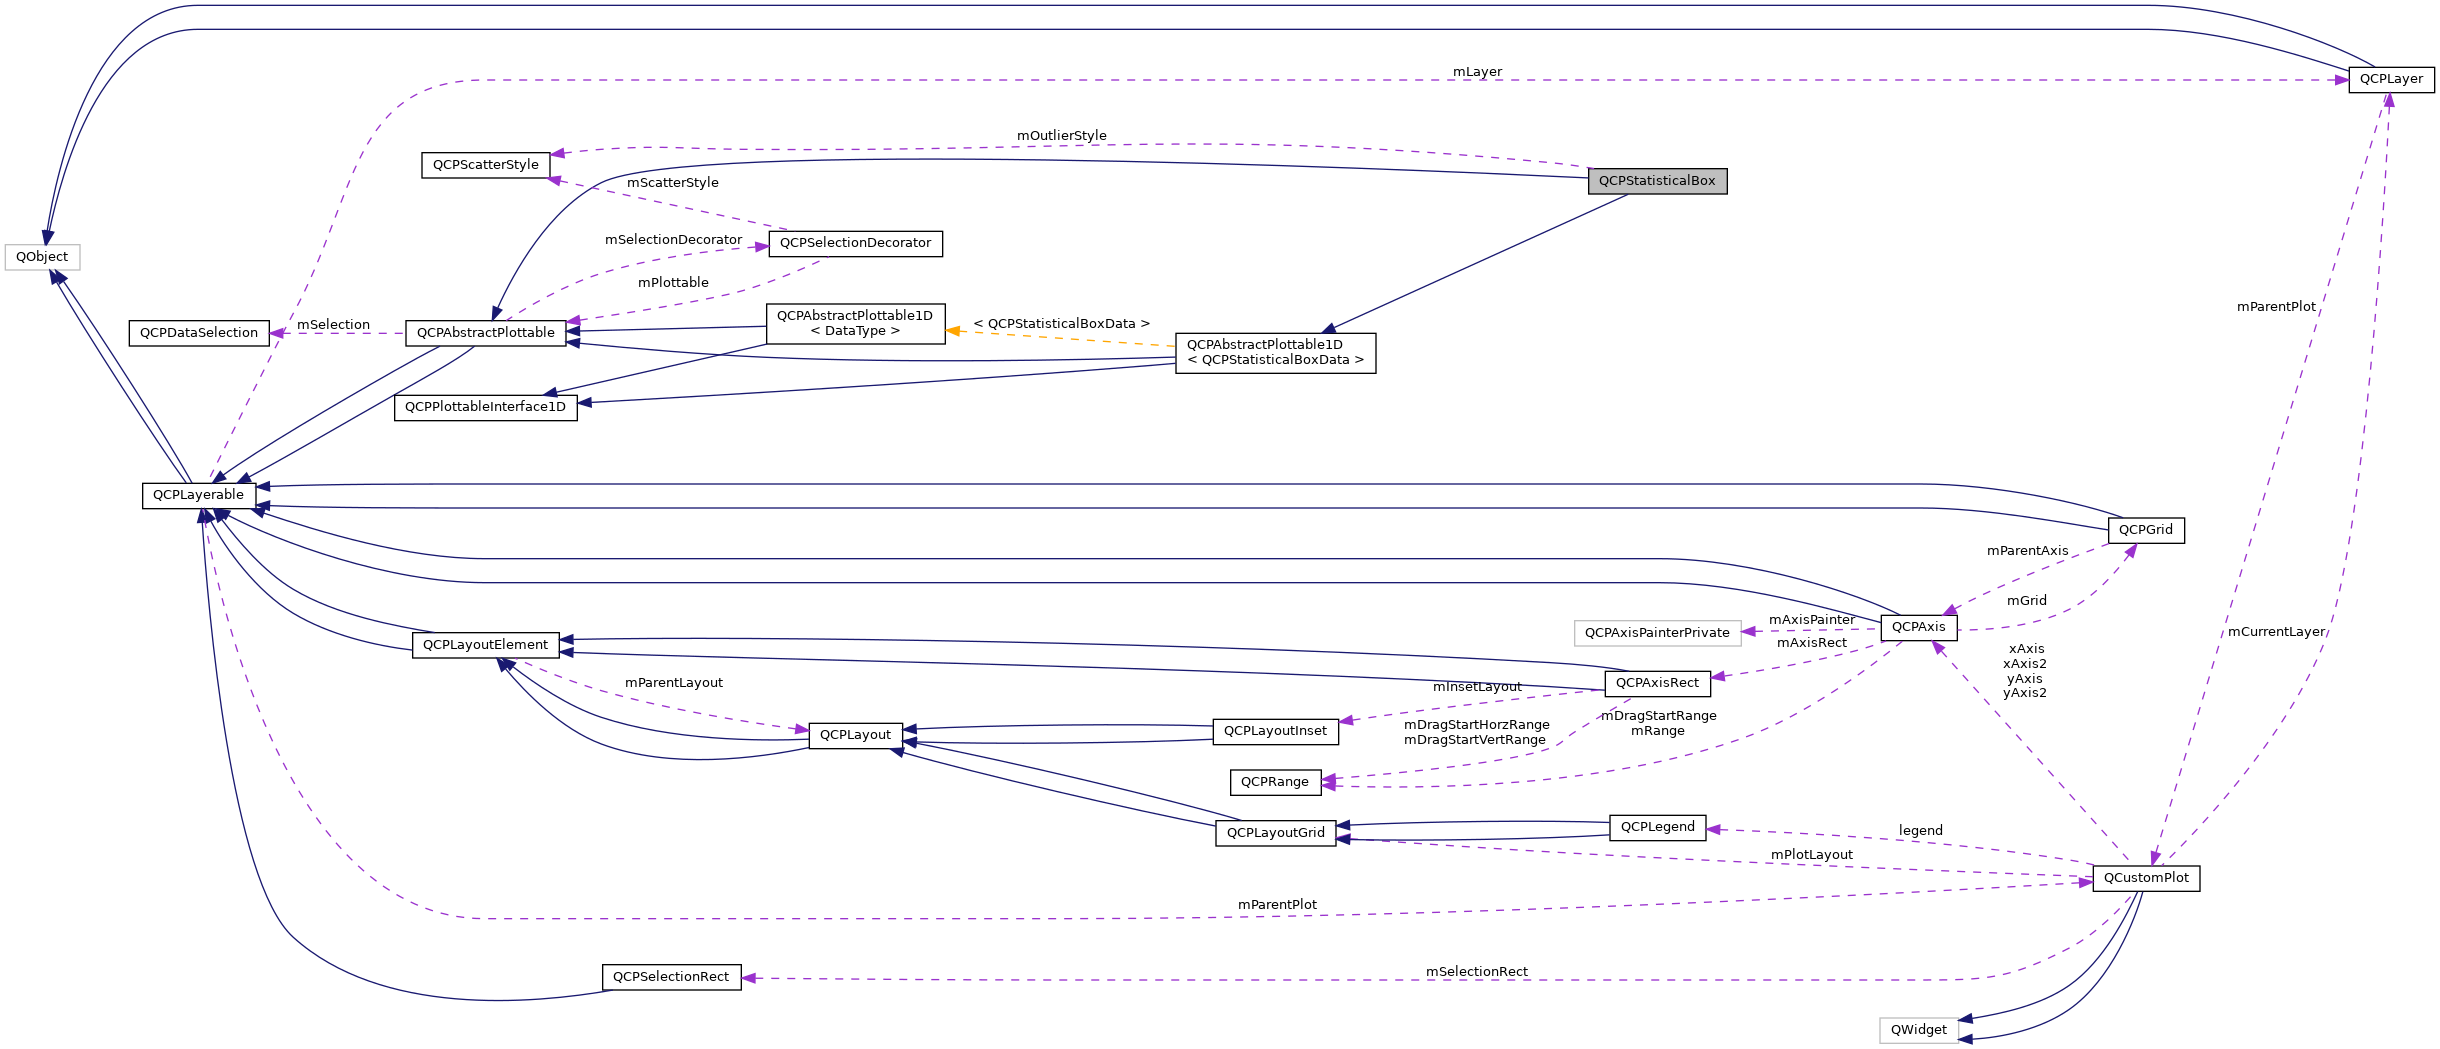
A plottable representing a single statistical box in a plot.

To plot data, assign it with the setData or addData functions. Alternatively, you can also access and modify the data via the data method, which returns a pointer to the internal QCPStatisticalBoxDataContainer.
Additionally each data point can itself have a list of outliers, drawn as scatter points at the key coordinate of the respective statistical box data point. They can either be set by using the respective addData method or accessing the individual data points through data, and setting the QVector<double> outliers of the data points directly.
The appearance of each data point box, ranging from the lower to the upper quartile, is controlled via setPen and setBrush. You may change the width of the boxes with setWidth in plot coordinates.
Each data point's visual representation also consists of two whiskers. Whiskers are the lines which reach from the upper quartile to the maximum, and from the lower quartile to the minimum. The appearance of the whiskers can be modified with: setWhiskerPen, setWhiskerBarPen, setWhiskerWidth. The whisker width is the width of the bar perpendicular to the whisker at the top (for maximum) and bottom (for minimum). If the whisker pen is changed, make sure to set the capStyle to Qt::FlatCap. Otherwise the backbone line might exceed the whisker bars by a few pixels due to the pen cap being not perfectly flat.
The median indicator line inside the box has its own pen, setMedianPen.
The outlier data points are drawn as normal scatter points. Their look can be controlled with setOutlierStyle
Like all data representing objects in QCustomPlot, the QCPStatisticalBox is a plottable (QCPAbstractPlottable). So the plottable-interface of QCustomPlot applies (QCustomPlot::plottable, QCustomPlot::removePlottable, etc.)
Usually, you first create an instance:
qcpstatisticalbox-creation-1 which registers it with the QCustomPlot instance of the passed axes. Note that this QCustomPlot instance takes ownership of the plottable, so do not delete it manually but use QCustomPlot::removePlottable() instead. The newly created plottable can be modified, e.g.:
To plot data, assign it with the individual parameter functions or use setData to set all parameters at once. The individual functions are:
Additionally you can define a list of outliers, drawn as scatter datapoints:
The appearance of the box itself is controlled via setPen and setBrush. You may change the width of the box with setWidth in plot coordinates (not pixels).
Analog functions exist for the minimum/maximum-whiskers: setWhiskerPen, setWhiskerBarPen, setWhiskerWidth. The whisker width is the width of the bar at the top (maximum) and bottom (minimum).
The median indicator line has its own pen, setMedianPen.
If the whisker backbone pen is changed, make sure to set the capStyle to Qt::FlatCap. Else, the backbone line might exceed the whisker bars by a few pixels due to the pen cap being not perfectly flat.
The Outlier data points are drawn as normal scatter points. Their look can be controlled with setOutlierStyle
Like all data representing objects in QCustomPlot, the QCPStatisticalBox is a plottable. Usually, you first create an instance and add it to the customPlot:
qcpstatisticalbox-creation-1 and then modify the properties of the newly created plottable, e.g.:
Definition at line 6604 of file qcustomplot.h.
Constructs a statistical box which uses keyAxis as its key axis ("x") and valueAxis as its value axis ("y"). keyAxis and valueAxis must reside in the same QCustomPlot instance and not have the same orientation. If either of these restrictions is violated, a corresponding message is printed to the debug output (qDebug), the construction is not aborted, though.
The created QCPStatisticalBox is automatically registered with the QCustomPlot instance inferred from keyAxis. This QCustomPlot instance takes ownership of the QCPStatisticalBox, so do not delete it manually but use QCustomPlot::removePlottable() instead.
Constructs a statistical box which uses keyAxis as its key axis ("x") and valueAxis as its value axis ("y"). keyAxis and valueAxis must reside in the same QCustomPlot instance and not have the same orientation. If either of these restrictions is violated, a corresponding message is printed to the debug output (qDebug), the construction is not aborted, though.
The constructed statistical box can be added to the plot with QCustomPlot::addPlottable, QCustomPlot then takes ownership of the statistical box.
Definition at line 26077 of file qcustomplot.cpp.
References ecvColor::black(), QCPAbstractPlottable::setBrush(), and QCPAbstractPlottable::setPen().
| void QCPStatisticalBox::addData | ( | const QVector< double > & | keys, |
| const QVector< double > & | minimum, | ||
| const QVector< double > & | lowerQuartile, | ||
| const QVector< double > & | median, | ||
| const QVector< double > & | upperQuartile, | ||
| const QVector< double > & | maximum, | ||
| bool | alreadySorted = false |
||
| ) |
This is an overloaded member function, provided for convenience. It differs from the above function only in what argument(s) it accepts.
Adds the provided points in keys, minimum, lowerQuartile, median, upperQuartile and maximum to the current data. The provided vectors should have equal length. Else, the number of added points will be the size of the smallest vector.
If you can guarantee that the passed data points are sorted by keys in ascending order, you can set alreadySorted to true, to improve performance by saving a sorting run.
Alternatively, you can also access and modify the data directly via the data method, which returns a pointer to the internal data container.
Definition at line 26223 of file qcustomplot.cpp.
References lowerQuartile(), maximum(), QCPAbstractPlottable1D< QCPStatisticalBoxData >::mDataContainer, median(), minimum(), and upperQuartile().
Referenced by setData().
| void QCPStatisticalBox::addData | ( | double | key, |
| double | minimum, | ||
| double | lowerQuartile, | ||
| double | median, | ||
| double | upperQuartile, | ||
| double | maximum, | ||
| const QVector< double > & | outliers = QVector<double>() |
||
| ) |
This is an overloaded member function, provided for convenience. It differs from the above function only in what argument(s) it accepts.
Adds the provided data point as key, minimum, lowerQuartile, median, upperQuartile and maximum to the current data.
Alternatively, you can also access and modify the data directly via the data method, which returns a pointer to the internal data container.
Definition at line 26272 of file qcustomplot.cpp.
References key(), lowerQuartile(), maximum(), QCPAbstractPlottable1D< QCPStatisticalBoxData >::mDataContainer, median(), minimum(), outliers(), and upperQuartile().
|
virtual |
Clears all data in the plottable.
Implements QCPAbstractPlottable.
Definition at line 20414 of file qcustomplot.cpp.
References setKey(), setLowerQuartile(), setMaximum(), setMedian(), setMinimum(), setOutliers(), and setUpperQuartile().
|
inline |
const
Returns a shared pointer to the internal data storage of type QCPStatisticalBoxDataContainer. You may use it to directly manipulate the data, which may be more convenient and faster than using the regular setData or addData methods.
Definition at line 6622 of file qcustomplot.h.
Referenced by setData().
|
protectedvirtual |
Implements QCPAbstractPlottable.
Definition at line 26392 of file qcustomplot.cpp.
References QCPSelectionDecorator::applyBrush(), QCPSelectionDecorator::applyPen(), QCPSelectionDecorator::drawDecoration(), drawStatisticalBox(), QCPAbstractPlottable1D< QCPStatisticalBoxData >::getDataSegments(), QCPSelectionDecorator::getFinalScatterStyle(), getVisibleDataBounds(), QCP::isInvalidData(), QCPAbstractPlottable::keyAxis(), QCPAbstractPlottable::mBrush, QCPAbstractPlottable1D< QCPStatisticalBoxData >::mDataContainer, QCPAbstractPlottable::mKeyAxis, mOutlierStyle, QCPAbstractPlottable::mPen, QCPAbstractPlottable::mSelectionDecorator, QCPAbstractPlottable::mValueAxis, QCPAbstractPlottable::name(), QCPAbstractPlottable::selection(), QCPPainter::setPen(), and QCPAbstractPlottable::valueAxis().
|
protectedvirtual |
Implements QCPAbstractPlottable.
|
protectedvirtual |
Implements QCPAbstractPlottable.
Definition at line 26455 of file qcustomplot.cpp.
References QCPAbstractPlottable::applyDefaultAntialiasingHint(), QCPAbstractPlottable::mBrush, QCPAbstractPlottable::mPen, and QCPPainter::setPen().
|
protectedvirtual |
Implements QCPAbstractPlottable.
|
protectedvirtual |
Definition at line 20521 of file qcustomplot.cpp.
References QCPAbstractPlottable::applyDefaultAntialiasingHint(), QCPAbstractPlottable::coordsToPixels(), QCPPainter::drawLine(), mKey, mMedian, mMedianPen, mWidth, and QCPPainter::setPen().
|
protectedvirtual |
Definition at line 20557 of file qcustomplot.cpp.
References QCPAbstractPlottable::applyScattersAntialiasingHint(), QCPScatterStyle::applyTo(), QCPAbstractPlottable::coordsToPixels(), QCPScatterStyle::drawShape(), mKey, mOutliers, mOutlierStyle, and QCPAbstractPlottable::mPen.
|
protectedvirtual |
Definition at line 20505 of file qcustomplot.cpp.
References QCPAbstractPlottable::applyDefaultAntialiasingHint(), QCPAbstractPlottable::coordsToPixels(), QCPAbstractPlottable::mainBrush(), QCPAbstractPlottable::mainPen(), mKey, mLowerQuartile, mUpperQuartile, mWidth, and QCPPainter::setPen().
|
protectedvirtual |
Draws the graphical representation of a single statistical box with the data given by the iterator it with the provided painter.
If the statistical box has a set of outlier data points, they are drawn with outlierStyle.
Definition at line 26475 of file qcustomplot.cpp.
References QCP::aePlottables, QCPLayerable::applyAntialiasingHint(), QCPAbstractPlottable::applyDefaultAntialiasingHint(), QCPAbstractPlottable::applyScattersAntialiasingHint(), QCPScatterStyle::applyTo(), QCPAbstractPlottable::coordsToPixels(), QCPPainter::drawLine(), QCPScatterStyle::drawShape(), getQuartileBox(), getWhiskerBackboneLines(), getWhiskerBarLines(), mMedianPen, QCPAbstractPlottable::mPen, mWhiskerAntialiased, mWhiskerBarPen, mWhiskerPen, mWidth, outlierStyle(), QCPPainter::restore(), QCPPainter::save(), and QCPPainter::setPen().
Referenced by draw().
|
protectedvirtual |
Definition at line 20534 of file qcustomplot.cpp.
References QCPAbstractPlottable::applyErrorBarsAntialiasingHint(), QCPAbstractPlottable::coordsToPixels(), QCPPainter::drawLine(), mKey, mLowerQuartile, mMaximum, mMinimum, mUpperQuartile, mWhiskerBarPen, mWhiskerPen, mWhiskerWidth, and QCPPainter::setPen().
|
virtual |
Returns the coordinate range that all data in this plottable span in the key axis dimension. For logarithmic plots, one can set inSignDomain to either QCP::sdNegative or QCP::sdPositive in order to restrict the returned range to that sign domain. E.g. when only negative range is wanted, set inSignDomain to QCP::sdNegative and all positive points will be ignored for range calculation. For no restriction, just set inSignDomain to QCP::sdBoth (default). foundRange is an output parameter that indicates whether a range could be found or not. If this is false, you shouldn't use the returned range (e.g. no points in data).
Note that foundRange is not the same as QCPRange::validRange, since the range returned by this function may have size zero (e.g. when there is only one data point). In this case foundRange would return true, but the returned range is not a valid range in terms of QCPRange::validRange.
Implements QCPAbstractPlottable.
Definition at line 26371 of file qcustomplot.cpp.
References QCPRange::lower, QCPAbstractPlottable1D< QCPStatisticalBoxData >::mDataContainer, mWidth, QCP::sdNegative, QCP::sdPositive, and QCPRange::upper.
|
protectedvirtual |
Implements QCPAbstractPlottable.
Definition at line 20565 of file qcustomplot.cpp.
References mKey, mWidth, QCPAbstractPlottable::sdBoth, QCPAbstractPlottable::sdNegative, and QCPAbstractPlottable::sdPositive.
|
protected |
Definition at line 26548 of file qcustomplot.cpp.
References QCPAbstractPlottable::coordsToPixels(), mWidth, and result.
Referenced by drawStatisticalBox(), selectTest(), and selectTestRect().
|
virtual |
Returns the coordinate range that the data points in the specified key range (inKeyRange) span in the value axis dimension. For logarithmic plots, one can set inSignDomain to either QCP::sdNegative or QCP::sdPositive in order to restrict the returned range to that sign domain. E.g. when only negative range is wanted, set inSignDomain to QCP::sdNegative and all positive points will be ignored for range calculation. For no restriction, just set inSignDomain to QCP::sdBoth (default). foundRange is an output parameter that indicates whether a range could be found or not. If this is false, you shouldn't use the returned range (e.g. no points in data).
If inKeyRange has both lower and upper bound set to zero (is equal to QCPRange()), all data points are considered, without any restriction on the keys.
Note that foundRange is not the same as QCPRange::validRange, since the range returned by this function may have size zero (e.g. when there is only one data point). In this case foundRange would return true, but the returned range is not a valid range in terms of QCPRange::validRange.
Implements QCPAbstractPlottable.
Definition at line 26385 of file qcustomplot.cpp.
References QCPAbstractPlottable1D< QCPStatisticalBoxData >::mDataContainer.
|
protectedvirtual |
called by rescaleAxes functions to get the full data value bounds. For logarithmic plots, one can set inSignDomain to either sdNegative or sdPositive in order to restrict the returned range to that sign domain. E.g. when only negative range is wanted, set inSignDomain to sdNegative and all positive points will be ignored for range calculation. For no restriction, just set inSignDomain to sdBoth (default). foundRange is an output parameter that indicates whether a range could be found or not. If this is false, you shouldn't use the returned range (e.g. no points in data).
Note that foundRange is not the same as QCPRange::validRange, since the range returned by this function may have size zero, which wouldn't count as a valid range.
Implements QCPAbstractPlottable.
Definition at line 20594 of file qcustomplot.cpp.
References mLowerQuartile, mMaximum, mMedian, mMinimum, mOutliers, mUpperQuartile, QCPAbstractPlottable::sdBoth, QCPAbstractPlottable::sdNegative, and QCPAbstractPlottable::sdPositive.
|
protected |
Definition at line 26521 of file qcustomplot.cpp.
References QCPAbstractPlottable1D< QCPStatisticalBoxData >::mDataContainer, QCPAbstractPlottable::mKeyAxis, and mWidth.
Referenced by draw(), selectTest(), and selectTestRect().
|
protected |
Definition at line 26566 of file qcustomplot.cpp.
References QCPAbstractPlottable::coordsToPixels(), and result.
Referenced by drawStatisticalBox(), and selectTest().
|
protected |
Definition at line 26584 of file qcustomplot.cpp.
References QCPAbstractPlottable::coordsToPixels(), mWhiskerWidth, and result.
Referenced by drawStatisticalBox().
|
inline |
Definition at line 3537 of file qcustomplot.h.
|
inline |
Definition at line 3539 of file qcustomplot.h.
|
inline |
Definition at line 3542 of file qcustomplot.h.
|
inline |
Definition at line 3540 of file qcustomplot.h.
|
inline |
Definition at line 6630 of file qcustomplot.h.
|
inline |
Definition at line 3548 of file qcustomplot.h.
|
inline |
Definition at line 3538 of file qcustomplot.h.
|
inline |
Definition at line 3543 of file qcustomplot.h.
Referenced by addData().
|
inline |
Definition at line 6631 of file qcustomplot.h.
Referenced by drawStatisticalBox().
|
inline |
Definition at line 3549 of file qcustomplot.h.
|
virtual |
Implements a selectTest specific to this plottable's point geometry.
If details is not 0, it will be set to a QCPDataSelection, describing the closest data point to pos.
\seebaseclassmethod QCPAbstractPlottable::selectTest
Implements QCPAbstractPlottable.
Definition at line 26318 of file qcustomplot.cpp.
References QCPVector2D::distanceSquaredToLine(), getQuartileBox(), getVisibleDataBounds(), getWhiskerBackboneLines(), QCPAbstractPlottable1D< QCPStatisticalBoxData >::mDataContainer, QCPAbstractPlottable::mKeyAxis, QCPLayerable::mParentPlot, QCPAbstractPlottable::mSelectable, QCPAbstractPlottable::mValueAxis, QCustomPlot::selectionTolerance(), and QCP::stNone.
|
virtual |
This function is used to decide whether a click hits a layerable object or not.
pos is a point in pixel coordinates on the QCustomPlot surface. This function returns the shortest pixel distance of this point to the object. If the object is either invisible or the distance couldn't be determined, -1.0 is returned. Further, if onlySelectable is true and the object is not selectable, -1.0 is returned, too.
If the object is represented not by single lines but by an area like a QCPItemText or the bars of a QCPBars plottable, a click inside the area should also be considered a hit. In these cases this function thus returns a constant value greater zero but still below the parent plot's selection tolerance. (typically the selectionTolerance multiplied by 0.99).
Providing a constant value for area objects allows selecting line objects even when they are obscured by such area objects, by clicking close to the lines (i.e. closer than 0.99*selectionTolerance).
The actual setting of the selection state is not done by this function. This is handled by the parent QCustomPlot when the mouseReleaseEvent occurs, and the finally selected object is notified via the selectEvent/ deselectEvent methods.
details is an optional output parameter. Every layerable subclass may place any information in details. This information will be passed to selectEvent when the parent QCustomPlot decides on the basis of this selectTest call, that the object was successfully selected. The subsequent call to selectEvent will carry the details. This is useful for multi-part objects (like QCPAxis). This way, a possibly complex calculation to decide which part was clicked is only done once in selectTest. The result (i.e. the actually clicked part) can then be placed in details. So in the subsequent selectEvent, the decision which part was selected doesn't have to be done a second time for a single selection operation.
In the case of 1D Plottables (QCPAbstractPlottable1D, like QCPGraph or QCPBars) details will be set to a QCPDataSelection, describing the closest data point to pos.
You may pass 0 as details to indicate that you are not interested in those selection details.
This function is used to decide whether a click hits a layerable object or not.
pos is a point in pixel coordinates on the QCustomPlot surface. This function returns the shortest pixel distance of this point to the object. If the object is either invisible or the distance couldn't be determined, -1.0 is returned. Further, if onlySelectable is true and the object is not selectable, -1.0 is returned, too.
If the object is represented not by single lines but by an area like a QCPItemText or the bars of a QCPBars plottable, a click inside the area should also be considered a hit. In these cases this function thus returns a constant value greater zero but still below the parent plot's selection tolerance. (typically the selectionTolerance multiplied by 0.99).
Providing a constant value for area objects allows selecting line objects even when they are obscured by such area objects, by clicking close to the lines (i.e. closer than 0.99*selectionTolerance).
The actual setting of the selection state is not done by this function. This is handled by the parent QCustomPlot when the mouseReleaseEvent occurs, and the finally selected object is notified via the selectEvent/deselectEvent methods.
details is an optional output parameter. Every layerable subclass may place any information in details. This information will be passed to selectEvent when the parent QCustomPlot decides on the basis of this selectTest call, that the object was successfully selected. The subsequent call to selectEvent will carry the details. This is useful for multi-part objects (like QCPAxis). This way, a possibly complex calculation to decide which part was clicked is only done once in selectTest. The result (i.e. the actually clicked part) can then be placed in details. So in the subsequent selectEvent, the decision which part was selected doesn't have to be done a second time for a single selection operation.
You may pass 0 as details to indicate that you are not interested in those selection details.
Implements QCPAbstractPlottable.
|
virtual |
Returns a data selection containing all the data points of this plottable which are contained (or hit by) rect. This is used mainly in the selection rect interaction for data selection (data selectionmechanism").
If onlySelectable is true, an empty QCPDataSelection is returned if this plottable is not selectable (i.e. if QCPAbstractPlottable::setSelectable is QCP::stNone).
QRect::normalized() when passing a rect which might not be normalized. Reimplemented from QCPAbstractPlottable1D< QCPStatisticalBoxData >.
Definition at line 26287 of file qcustomplot.cpp.
References getQuartileBox(), getVisibleDataBounds(), QCPAbstractPlottable1D< QCPStatisticalBoxData >::mDataContainer, QCPAbstractPlottable::mKeyAxis, QCPAbstractPlottable::mSelectable, QCPAbstractPlottable::mValueAxis, result, and QCP::stNone.
| void QCPStatisticalBox::setData | ( | const QVector< double > & | keys, |
| const QVector< double > & | minimum, | ||
| const QVector< double > & | lowerQuartile, | ||
| const QVector< double > & | median, | ||
| const QVector< double > & | upperQuartile, | ||
| const QVector< double > & | maximum, | ||
| bool | alreadySorted = false |
||
| ) |
This is an overloaded member function, provided for convenience. It differs from the above function only in what argument(s) it accepts.
Replaces the current data with the provided points in keys, minimum, lowerQuartile, median, upperQuartile and maximum. The provided vectors should have equal length. Else, the number of added points will be the size of the smallest vector.
If you can guarantee that the passed data points are sorted by keys in ascending order, you can set alreadySorted to true, to improve performance by saving a sorting run.
Definition at line 26124 of file qcustomplot.cpp.
References addData(), lowerQuartile(), maximum(), QCPAbstractPlottable1D< QCPStatisticalBoxData >::mDataContainer, median(), minimum(), and upperQuartile().
| void QCPStatisticalBox::setData | ( | double | key, |
| double | minimum, | ||
| double | lowerQuartile, | ||
| double | median, | ||
| double | upperQuartile, | ||
| double | maximum | ||
| ) |
Sets all parameters of the statistical box plot at once.
Definition at line 20347 of file qcustomplot.cpp.
References key(), lowerQuartile(), maximum(), median(), minimum(), setKey(), setLowerQuartile(), setMaximum(), setMedian(), setMinimum(), setUpperQuartile(), and upperQuartile().
| void QCPStatisticalBox::setData | ( | QSharedPointer< QCPStatisticalBoxDataContainer > | data | ) |
This is an overloaded member function, provided for convenience. It differs from the above function only in what argument(s) it accepts.
Replaces the current data container with the provided data container.
Since a QSharedPointer is used, multiple QCPStatisticalBoxes may share the same data container safely. Modifying the data in the container will then affect all statistical boxes that share the container. Sharing can be achieved by simply exchanging the data containers wrapped in shared pointers:
If you do not wish to share containers, but create a copy from an existing container, rather use the QCPDataContainer<DataType>::set method on the statistical box data container directly:
Definition at line 26107 of file qcustomplot.cpp.
References data(), and QCPAbstractPlottable1D< QCPStatisticalBoxData >::mDataContainer.
| void QCPStatisticalBox::setKey | ( | double | key | ) |
Sets the key coordinate of the statistical box.
Definition at line 20277 of file qcustomplot.cpp.
Referenced by clearData(), and setData().
| void QCPStatisticalBox::setLowerQuartile | ( | double | value | ) |
Sets the parameter "lower Quartile" of the statistical box plot. This is the lower end of the box. The lower and the upper quartiles are the two statistical quartiles around the median of the sample, they contain 50% of the sample data.
Definition at line 20296 of file qcustomplot.cpp.
References mLowerQuartile.
Referenced by clearData(), and setData().
| void QCPStatisticalBox::setMaximum | ( | double | value | ) |
Sets the parameter "maximum" of the statistical box plot. This is the position of the upper whisker, typically the maximum measurement of the sample that's not considered an outlier.
Definition at line 20328 of file qcustomplot.cpp.
References mMaximum.
Referenced by clearData(), and setData().
| void QCPStatisticalBox::setMedian | ( | double | value | ) |
Sets the parameter "median" of the statistical box plot. This is the value of the median mark inside the quartile box. The median separates the sample data in half (50% of the sample data is below/above the median).
Definition at line 20307 of file qcustomplot.cpp.
References mMedian.
Referenced by clearData(), and setData().
| void QCPStatisticalBox::setMedianPen | ( | const QPen & | pen | ) |
Sets the pen used for drawing the median indicator line inside the statistical boxes.
Sets the pen used for drawing the median indicator line inside the statistical box.
Definition at line 26196 of file qcustomplot.cpp.
References mMedianPen, and QCPAbstractPlottable::pen().
| void QCPStatisticalBox::setMedianPen | ( | const QPen & | pen | ) |
| void QCPStatisticalBox::setMinimum | ( | double | value | ) |
Sets the parameter "minimum" of the statistical box plot. This is the position of the lower whisker, typically the minimum measurement of the sample that's not considered an outlier.
Definition at line 20286 of file qcustomplot.cpp.
References mMinimum.
Referenced by clearData(), and setData().
| void QCPStatisticalBox::setOutliers | ( | const QVector< double > & | values | ) |
Sets a vector of outlier values that will be drawn as scatters. Any data points in the sample that are not within the whiskers (setMinimum, setMaximum) should be considered outliers and displayed as such.
Definition at line 20337 of file qcustomplot.cpp.
References mOutliers.
Referenced by clearData().
| void QCPStatisticalBox::setOutlierStyle | ( | const QCPScatterStyle & | style | ) |
Sets the appearance of the outlier data points.
Outliers can be specified with the method addData(double key, double minimum, double lowerQuartile, double median, double upperQuartile, double maximum, const QVector<double> &outliers)
Sets the appearance of the outlier data points.
Definition at line 26205 of file qcustomplot.cpp.
References mOutlierStyle.
| void QCPStatisticalBox::setOutlierStyle | ( | const QCPScatterStyle & | style | ) |
| void QCPStatisticalBox::setUpperQuartile | ( | double | value | ) |
Sets the parameter "upper Quartile" of the statistical box plot. This is the upper end of the box. The lower and the upper quartiles are the two statistical quartiles around the median of the sample, they contain 50% of the sample data.
Definition at line 20317 of file qcustomplot.cpp.
References mUpperQuartile.
Referenced by clearData(), and setData().
| void QCPStatisticalBox::setWhiskerAntialiased | ( | bool | enabled | ) |
Sets whether the statistical boxes whiskers are drawn with antialiasing or not.
Note that antialiasing settings may be overridden by QCustomPlot::setAntialiasedElements and QCustomPlot::setNotAntialiasedElements.
Definition at line 26188 of file qcustomplot.cpp.
References mWhiskerAntialiased.
| void QCPStatisticalBox::setWhiskerBarPen | ( | const QPen & | pen | ) |
Sets the pen used for drawing the whisker bars. Those are the lines parallel to the key axis at each end of the whisker backbone.
Whiskers are the lines which reach from the upper quartile to the maximum, and from the lower quartile to the minimum.
Sets the pen used for drawing the whisker bars (Those are the lines parallel to the key axis at each end of the whisker backbone).
Definition at line 26176 of file qcustomplot.cpp.
References mWhiskerBarPen, and QCPAbstractPlottable::pen().
| void QCPStatisticalBox::setWhiskerBarPen | ( | const QPen & | pen | ) |
| void QCPStatisticalBox::setWhiskerPen | ( | const QPen & | pen | ) |
Sets the pen used for drawing the whisker backbone.
Whiskers are the lines which reach from the upper quartile to the maximum, and from the lower quartile to the minimum.
Make sure to set the capStyle of the passed pen to Qt::FlatCap. Otherwise the backbone line might exceed the whisker bars by a few pixels due to the pen cap being not perfectly flat.
Sets the pen used for drawing the whisker backbone (That's the line parallel to the value axis).
Make sure to set the pen capStyle to Qt::FlatCap to prevent the whisker backbone from reaching a few pixels past the whisker bars, when using a non-zero pen width.
Definition at line 26165 of file qcustomplot.cpp.
References mWhiskerPen, and QCPAbstractPlottable::pen().
| void QCPStatisticalBox::setWhiskerPen | ( | const QPen & | pen | ) |
| void QCPStatisticalBox::setWhiskerWidth | ( | double | width | ) |
Sets the width of the whiskers in key coordinates.
Whiskers are the lines which reach from the upper quartile to the maximum, and from the lower quartile to the minimum.
Sets the width of the whiskers (setMinimum, setMaximum) in key coordinates.
Definition at line 26151 of file qcustomplot.cpp.
References mWhiskerWidth, and width().
| void QCPStatisticalBox::setWhiskerWidth | ( | double | width | ) |
| void QCPStatisticalBox::setWidth | ( | double | width | ) |
Sets the width of the boxes in key coordinates.
Sets the width of the box in key coordinates.
Definition at line 26141 of file qcustomplot.cpp.
| void QCPStatisticalBox::setWidth | ( | double | width | ) |
|
inline |
Definition at line 3541 of file qcustomplot.h.
|
inline |
Definition at line 6629 of file qcustomplot.h.
|
inline |
Definition at line 6628 of file qcustomplot.h.
|
inline |
Definition at line 3547 of file qcustomplot.h.
|
inline |
Definition at line 6627 of file qcustomplot.h.
|
inline |
Definition at line 3546 of file qcustomplot.h.
|
inline |
Definition at line 6626 of file qcustomplot.h.
|
inline |
Definition at line 3545 of file qcustomplot.h.
|
inline |
Definition at line 6625 of file qcustomplot.h.
Referenced by setWhiskerWidth(), and setWidth().
|
inline |
Definition at line 3544 of file qcustomplot.h.
|
protected |
Definition at line 3581 of file qcustomplot.h.
Referenced by drawMedian(), drawOutliers(), drawQuartileBox(), drawWhiskers(), getKeyRange(), and setKey().
|
protected |
Definition at line 3581 of file qcustomplot.h.
Referenced by drawQuartileBox(), drawWhiskers(), getValueRange(), and setLowerQuartile().
|
protected |
Definition at line 3581 of file qcustomplot.h.
Referenced by drawWhiskers(), getValueRange(), and setMaximum().
|
protected |
Definition at line 3581 of file qcustomplot.h.
Referenced by drawMedian(), getValueRange(), and setMedian().
|
protected |
Definition at line 6686 of file qcustomplot.h.
Referenced by drawMedian(), drawStatisticalBox(), and setMedianPen().
|
protected |
Definition at line 3581 of file qcustomplot.h.
Referenced by drawWhiskers(), getValueRange(), and setMinimum().
|
protected |
Definition at line 3580 of file qcustomplot.h.
Referenced by drawOutliers(), getValueRange(), and setOutliers().
|
protected |
Definition at line 6687 of file qcustomplot.h.
Referenced by draw(), drawOutliers(), and setOutlierStyle().
|
protected |
Definition at line 3581 of file qcustomplot.h.
Referenced by drawQuartileBox(), drawWhiskers(), getValueRange(), and setUpperQuartile().
|
protected |
Definition at line 6685 of file qcustomplot.h.
Referenced by drawStatisticalBox(), and setWhiskerAntialiased().
|
protected |
Definition at line 6684 of file qcustomplot.h.
Referenced by drawStatisticalBox(), drawWhiskers(), and setWhiskerBarPen().
|
protected |
Definition at line 6684 of file qcustomplot.h.
Referenced by drawStatisticalBox(), drawWhiskers(), and setWhiskerPen().
|
protected |
Definition at line 6683 of file qcustomplot.h.
Referenced by drawWhiskers(), getWhiskerBarLines(), and setWhiskerWidth().
|
protected |
Definition at line 6682 of file qcustomplot.h.
Referenced by drawMedian(), drawQuartileBox(), drawStatisticalBox(), getKeyRange(), getQuartileBox(), getVisibleDataBounds(), and setWidth().