|
ACloudViewer
3.9.4
A Modern Library for 3D Data Processing
|
|
ACloudViewer
3.9.4
A Modern Library for 3D Data Processing
|
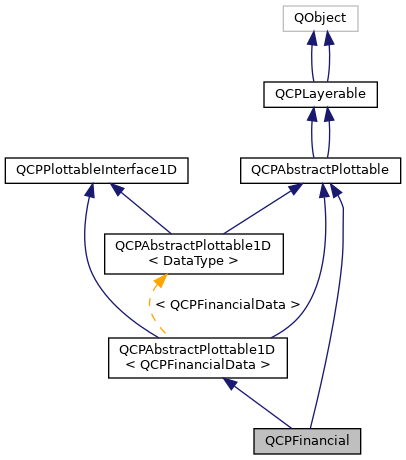
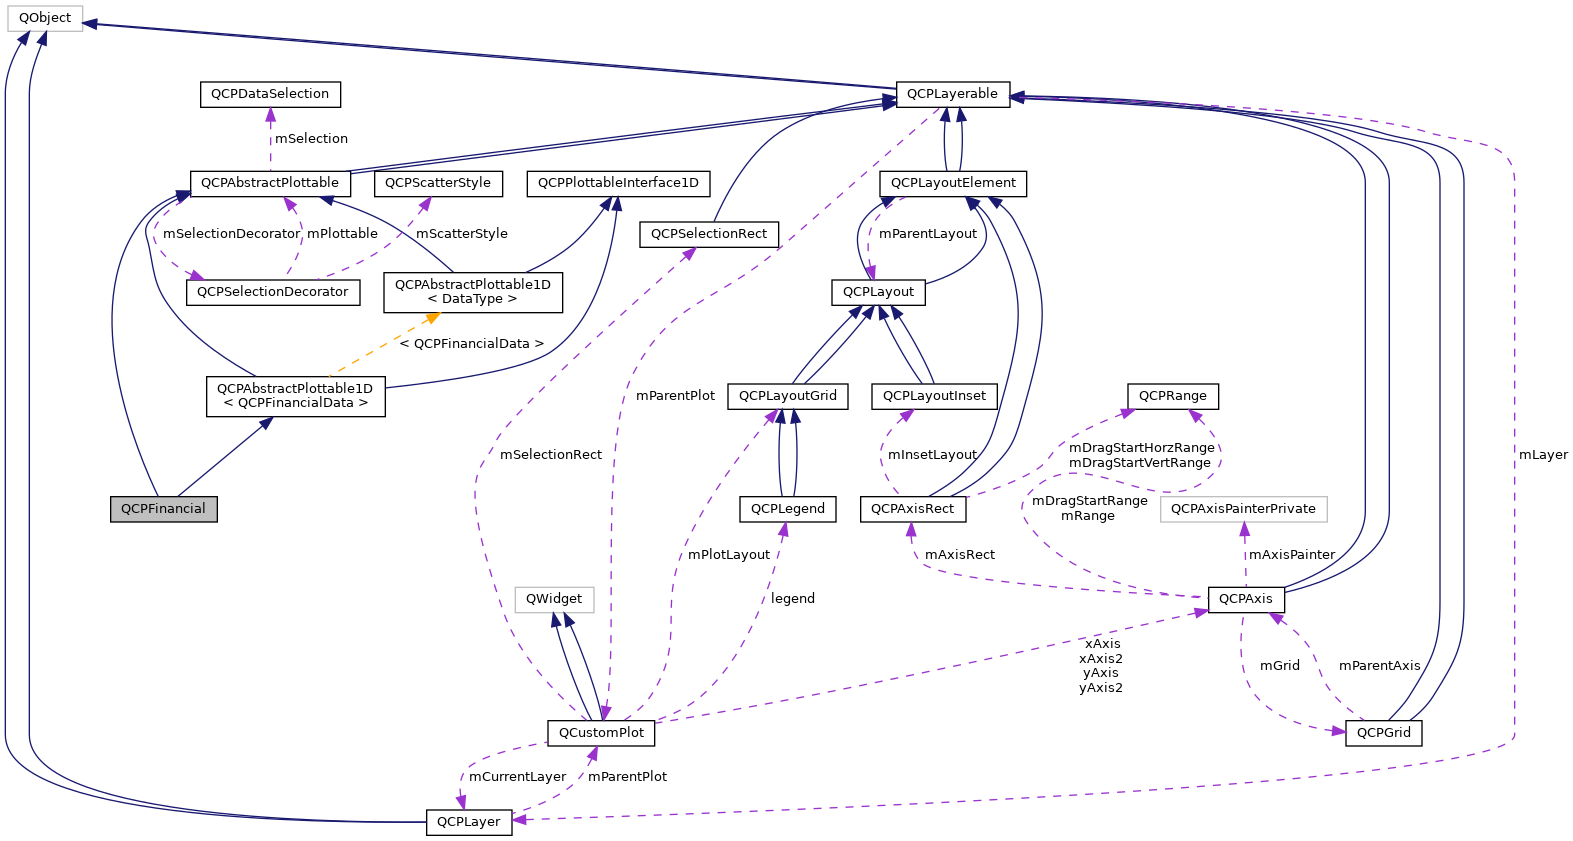
A plottable representing a financial stock chart. More...
#include <qcustomplot.h>
Public Types | |
| enum | WidthType { wtAbsolute , wtAxisRectRatio , wtPlotCoords } |
| enum | ChartStyle { csOhlc , csCandlestick , csOhlc , csCandlestick } |
| enum | ChartStyle { csOhlc , csCandlestick , csOhlc , csCandlestick } |
Public Member Functions | |
| QCPFinancial (QCPAxis *keyAxis, QCPAxis *valueAxis) | |
| virtual | ~QCPFinancial () |
| QSharedPointer< QCPFinancialDataContainer > | data () const |
| ChartStyle | chartStyle () const |
| double | width () const |
| WidthType | widthType () const |
| bool | twoColored () const |
| QBrush | brushPositive () const |
| QBrush | brushNegative () const |
| QPen | penPositive () const |
| QPen | penNegative () const |
| void | setData (QSharedPointer< QCPFinancialDataContainer > data) |
| void | setData (const QVector< double > &keys, const QVector< double > &open, const QVector< double > &high, const QVector< double > &low, const QVector< double > &close, bool alreadySorted=false) |
| void | setChartStyle (ChartStyle style) |
| void | setWidth (double width) |
| void | setWidthType (WidthType widthType) |
| void | setTwoColored (bool twoColored) |
| void | setBrushPositive (const QBrush &brush) |
| void | setBrushNegative (const QBrush &brush) |
| void | setPenPositive (const QPen &pen) |
| void | setPenNegative (const QPen &pen) |
| void | addData (const QVector< double > &keys, const QVector< double > &open, const QVector< double > &high, const QVector< double > &low, const QVector< double > &close, bool alreadySorted=false) |
| void | addData (double key, double open, double high, double low, double close) |
| virtual QCPDataSelection | selectTestRect (const QRectF &rect, bool onlySelectable) const |
| virtual double | selectTest (const QPointF &pos, bool onlySelectable, QVariant *details=0) const |
| virtual QCPRange | getKeyRange (bool &foundRange, QCP::SignDomain inSignDomain=QCP::sdBoth) const |
| virtual QCPRange | getValueRange (bool &foundRange, QCP::SignDomain inSignDomain=QCP::sdBoth, const QCPRange &inKeyRange=QCPRange()) const |
| QCPFinancial (QCPAxis *keyAxis, QCPAxis *valueAxis) | |
| virtual | ~QCPFinancial () |
| QCPFinancialDataMap * | data () const |
| ChartStyle | chartStyle () const |
| double | width () const |
| bool | twoColored () const |
| QBrush | brushPositive () const |
| QBrush | brushNegative () const |
| QPen | penPositive () const |
| QPen | penNegative () const |
| void | setData (QCPFinancialDataMap *data, bool copy=false) |
| void | setData (const QVector< double > &key, const QVector< double > &open, const QVector< double > &high, const QVector< double > &low, const QVector< double > &close) |
| void | setChartStyle (ChartStyle style) |
| void | setWidth (double width) |
| void | setTwoColored (bool twoColored) |
| void | setBrushPositive (const QBrush &brush) |
| void | setBrushNegative (const QBrush &brush) |
| void | setPenPositive (const QPen &pen) |
| void | setPenNegative (const QPen &pen) |
| void | addData (const QCPFinancialDataMap &dataMap) |
| void | addData (const QCPFinancialData &data) |
| void | addData (double key, double open, double high, double low, double close) |
| void | addData (const QVector< double > &key, const QVector< double > &open, const QVector< double > &high, const QVector< double > &low, const QVector< double > &close) |
| void | removeDataBefore (double key) |
| void | removeDataAfter (double key) |
| void | removeData (double fromKey, double toKey) |
| void | removeData (double key) |
| virtual void | clearData () |
| virtual double | selectTest (const QPointF &pos, bool onlySelectable, QVariant *details=0) const |
 Public Member Functions inherited from QCPAbstractPlottable1D< QCPFinancialData > Public Member Functions inherited from QCPAbstractPlottable1D< QCPFinancialData > | |
| QCPAbstractPlottable1D (QCPAxis *keyAxis, QCPAxis *valueAxis) | |
| virtual | ~QCPAbstractPlottable1D () |
| virtual int | dataCount () const |
| virtual double | dataMainKey (int index) const |
| virtual double | dataSortKey (int index) const |
| virtual double | dataMainValue (int index) const |
| virtual QCPRange | dataValueRange (int index) const |
| virtual QPointF | dataPixelPosition (int index) const |
| virtual bool | sortKeyIsMainKey () const |
| virtual int | findBegin (double sortKey, bool expandedRange=true) const |
| virtual int | findEnd (double sortKey, bool expandedRange=true) const |
| virtual QCPPlottableInterface1D * | interface1D () |
| Public Member Functions inherited from QCPAbstractPlottable | |
| QCPAbstractPlottable (QCPAxis *keyAxis, QCPAxis *valueAxis) | |
| virtual | ~QCPAbstractPlottable () |
| QString | name () const |
| bool | antialiasedFill () const |
| bool | antialiasedScatters () const |
| QPen | pen () const |
| QBrush | brush () const |
| QCPAxis * | keyAxis () const |
| QCPAxis * | valueAxis () const |
| QCP::SelectionType | selectable () const |
| bool | selected () const |
| QCPDataSelection | selection () const |
| QCPSelectionDecorator * | selectionDecorator () const |
| void | setName (const QString &name) |
| void | setAntialiasedFill (bool enabled) |
| void | setAntialiasedScatters (bool enabled) |
| void | setPen (const QPen &pen) |
| void | setBrush (const QBrush &brush) |
| void | setKeyAxis (QCPAxis *axis) |
| void | setValueAxis (QCPAxis *axis) |
| Q_SLOT void | setSelectable (QCP::SelectionType selectable) |
| Q_SLOT void | setSelection (QCPDataSelection selection) |
| void | setSelectionDecorator (QCPSelectionDecorator *decorator) |
| void | coordsToPixels (double key, double value, double &x, double &y) const |
| const QPointF | coordsToPixels (double key, double value) const |
| void | pixelsToCoords (double x, double y, double &key, double &value) const |
| void | pixelsToCoords (const QPointF &pixelPos, double &key, double &value) const |
| void | rescaleAxes (bool onlyEnlarge=false) const |
| void | rescaleKeyAxis (bool onlyEnlarge=false) const |
| void | rescaleValueAxis (bool onlyEnlarge=false, bool inKeyRange=false) const |
| bool | addToLegend (QCPLegend *legend) |
| bool | addToLegend () |
| bool | removeFromLegend (QCPLegend *legend) const |
| bool | removeFromLegend () const |
| QCPAbstractPlottable (QCPAxis *keyAxis, QCPAxis *valueAxis) | |
| QString | name () const |
| bool | antialiasedFill () const |
| bool | antialiasedScatters () const |
| bool | antialiasedErrorBars () const |
| QPen | pen () const |
| QPen | selectedPen () const |
| QBrush | brush () const |
| QBrush | selectedBrush () const |
| QCPAxis * | keyAxis () const |
| QCPAxis * | valueAxis () const |
| bool | selectable () const |
| bool | selected () const |
| void | setName (const QString &name) |
| void | setAntialiasedFill (bool enabled) |
| void | setAntialiasedScatters (bool enabled) |
| void | setAntialiasedErrorBars (bool enabled) |
| void | setPen (const QPen &pen) |
| void | setSelectedPen (const QPen &pen) |
| void | setBrush (const QBrush &brush) |
| void | setSelectedBrush (const QBrush &brush) |
| void | setKeyAxis (QCPAxis *axis) |
| void | setValueAxis (QCPAxis *axis) |
| Q_SLOT void | setSelectable (bool selectable) |
| Q_SLOT void | setSelected (bool selected) |
| virtual bool | addToLegend () |
| virtual bool | removeFromLegend () const |
| void | rescaleAxes (bool onlyEnlarge=false) const |
| void | rescaleKeyAxis (bool onlyEnlarge=false) const |
| void | rescaleValueAxis (bool onlyEnlarge=false) const |
| Public Member Functions inherited from QCPLayerable | |
| QCPLayerable (QCustomPlot *plot, QString targetLayer=QString(), QCPLayerable *parentLayerable=0) | |
| virtual | ~QCPLayerable () |
| bool | visible () const |
| QCustomPlot * | parentPlot () const |
| QCPLayerable * | parentLayerable () const |
| QCPLayer * | layer () const |
| bool | antialiased () const |
| void | setVisible (bool on) |
| Q_SLOT bool | setLayer (QCPLayer *layer) |
| bool | setLayer (const QString &layerName) |
| void | setAntialiased (bool enabled) |
| bool | realVisibility () const |
| QCPLayerable (QCustomPlot *plot, QString targetLayer=QString(), QCPLayerable *parentLayerable=0) | |
| ~QCPLayerable () | |
| bool | visible () const |
| QCustomPlot * | parentPlot () const |
| QCPLayerable * | parentLayerable () const |
| QCPLayer * | layer () const |
| bool | antialiased () const |
| void | setVisible (bool on) |
| Q_SLOT bool | setLayer (QCPLayer *layer) |
| bool | setLayer (const QString &layerName) |
| void | setAntialiased (bool enabled) |
| bool | realVisibility () const |
| Public Member Functions inherited from QCPPlottableInterface1D | |
| virtual | ~QCPPlottableInterface1D () |
Static Public Member Functions | |
| static QCPFinancialDataContainer | timeSeriesToOhlc (const QVector< double > &time, const QVector< double > &value, double timeBinSize, double timeBinOffset=0) |
| static QCPFinancialDataMap | timeSeriesToOhlc (const QVector< double > &time, const QVector< double > &value, double timeBinSize, double timeBinOffset=0) |
Protected Member Functions | |
| virtual void | draw (QCPPainter *painter) |
| virtual void | drawLegendIcon (QCPPainter *painter, const QRectF &rect) const |
| void | drawOhlcPlot (QCPPainter *painter, const QCPFinancialDataContainer::const_iterator &begin, const QCPFinancialDataContainer::const_iterator &end, bool isSelected) |
| void | drawCandlestickPlot (QCPPainter *painter, const QCPFinancialDataContainer::const_iterator &begin, const QCPFinancialDataContainer::const_iterator &end, bool isSelected) |
| double | getPixelWidth (double key, double keyPixel) const |
| double | ohlcSelectTest (const QPointF &pos, const QCPFinancialDataContainer::const_iterator &begin, const QCPFinancialDataContainer::const_iterator &end, QCPFinancialDataContainer::const_iterator &closestDataPoint) const |
| double | candlestickSelectTest (const QPointF &pos, const QCPFinancialDataContainer::const_iterator &begin, const QCPFinancialDataContainer::const_iterator &end, QCPFinancialDataContainer::const_iterator &closestDataPoint) const |
| void | getVisibleDataBounds (QCPFinancialDataContainer::const_iterator &begin, QCPFinancialDataContainer::const_iterator &end) const |
| QRectF | selectionHitBox (QCPFinancialDataContainer::const_iterator it) const |
| virtual void | draw (QCPPainter *painter) |
| virtual void | drawLegendIcon (QCPPainter *painter, const QRectF &rect) const |
| virtual QCPRange | getKeyRange (bool &foundRange, SignDomain inSignDomain=sdBoth) const |
| virtual QCPRange | getValueRange (bool &foundRange, SignDomain inSignDomain=sdBoth) const |
| void | drawOhlcPlot (QCPPainter *painter, const QCPFinancialDataMap::const_iterator &begin, const QCPFinancialDataMap::const_iterator &end) |
| void | drawCandlestickPlot (QCPPainter *painter, const QCPFinancialDataMap::const_iterator &begin, const QCPFinancialDataMap::const_iterator &end) |
| double | ohlcSelectTest (const QPointF &pos, const QCPFinancialDataMap::const_iterator &begin, const QCPFinancialDataMap::const_iterator &end) const |
| double | candlestickSelectTest (const QPointF &pos, const QCPFinancialDataMap::const_iterator &begin, const QCPFinancialDataMap::const_iterator &end) const |
| void | getVisibleDataBounds (QCPFinancialDataMap::const_iterator &lower, QCPFinancialDataMap::const_iterator &upper) const |
| Protected Member Functions inherited from QCPAbstractPlottable1D< QCPFinancialData > | |
| void | getDataSegments (QList< QCPDataRange > &selectedSegments, QList< QCPDataRange > &unselectedSegments) const |
| void | drawPolyline (QCPPainter *painter, const QVector< QPointF > &lineData) const |
| Protected Member Functions inherited from QCPAbstractPlottable | |
| virtual QRect | clipRect () const |
| virtual QCP::Interaction | selectionCategory () const |
| void | applyDefaultAntialiasingHint (QCPPainter *painter) const |
| virtual void | selectEvent (QMouseEvent *event, bool additive, const QVariant &details, bool *selectionStateChanged) |
| virtual void | deselectEvent (bool *selectionStateChanged) |
| void | applyFillAntialiasingHint (QCPPainter *painter) const |
| void | applyScattersAntialiasingHint (QCPPainter *painter) const |
| virtual QRect | clipRect () const |
| virtual QCP::Interaction | selectionCategory () const |
| void | applyDefaultAntialiasingHint (QCPPainter *painter) const |
| virtual void | selectEvent (QMouseEvent *event, bool additive, const QVariant &details, bool *selectionStateChanged) |
| virtual void | deselectEvent (bool *selectionStateChanged) |
| void | coordsToPixels (double key, double value, double &x, double &y) const |
| const QPointF | coordsToPixels (double key, double value) const |
| void | pixelsToCoords (double x, double y, double &key, double &value) const |
| void | pixelsToCoords (const QPointF &pixelPos, double &key, double &value) const |
| QPen | mainPen () const |
| QBrush | mainBrush () const |
| void | applyFillAntialiasingHint (QCPPainter *painter) const |
| void | applyScattersAntialiasingHint (QCPPainter *painter) const |
| void | applyErrorBarsAntialiasingHint (QCPPainter *painter) const |
| double | distSqrToLine (const QPointF &start, const QPointF &end, const QPointF &point) const |
| Protected Member Functions inherited from QCPLayerable | |
| virtual void | parentPlotInitialized (QCustomPlot *parentPlot) |
| virtual void | mousePressEvent (QMouseEvent *event, const QVariant &details) |
| virtual void | mouseMoveEvent (QMouseEvent *event, const QPointF &startPos) |
| virtual void | mouseReleaseEvent (QMouseEvent *event, const QPointF &startPos) |
| virtual void | mouseDoubleClickEvent (QMouseEvent *event, const QVariant &details) |
| virtual void | wheelEvent (QWheelEvent *event) |
| void | initializeParentPlot (QCustomPlot *parentPlot) |
| void | setParentLayerable (QCPLayerable *parentLayerable) |
| bool | moveToLayer (QCPLayer *layer, bool prepend) |
| void | applyAntialiasingHint (QCPPainter *painter, bool localAntialiased, QCP::AntialiasedElement overrideElement) const |
| virtual void | parentPlotInitialized (QCustomPlot *parentPlot) |
| void | initializeParentPlot (QCustomPlot *parentPlot) |
| void | setParentLayerable (QCPLayerable *parentLayerable) |
| bool | moveToLayer (QCPLayer *layer, bool prepend) |
| void | applyAntialiasingHint (QCPPainter *painter, bool localAntialiased, QCP::AntialiasedElement overrideElement) const |
Protected Attributes | |
| ChartStyle | mChartStyle |
| double | mWidth |
| WidthType | mWidthType |
| bool | mTwoColored |
| QBrush | mBrushPositive |
| QBrush | mBrushNegative |
| QPen | mPenPositive |
| QPen | mPenNegative |
| QCPFinancialDataMap * | mData |
| Protected Attributes inherited from QCPAbstractPlottable1D< QCPFinancialData > | |
| QSharedPointer< QCPDataContainer< QCPFinancialData > > | mDataContainer |
| Protected Attributes inherited from QCPAbstractPlottable | |
| QString | mName |
| bool | mAntialiasedFill |
| bool | mAntialiasedScatters |
| QPen | mPen |
| QBrush | mBrush |
| QPointer< QCPAxis > | mKeyAxis |
| QPointer< QCPAxis > | mValueAxis |
| QCP::SelectionType | mSelectable |
| QCPDataSelection | mSelection |
| QCPSelectionDecorator * | mSelectionDecorator |
| bool | mAntialiasedErrorBars |
| QPen | mSelectedPen |
| QBrush | mSelectedBrush |
| bool | mSelectable |
| bool | mSelected |
| Protected Attributes inherited from QCPLayerable | |
| bool | mVisible |
| QCustomPlot * | mParentPlot |
| QPointer< QCPLayerable > | mParentLayerable |
| QCPLayer * | mLayer |
| bool | mAntialiased |
Additional Inherited Members | |
| Signals inherited from QCPAbstractPlottable | |
| void | selectionChanged (bool selected) |
| void | selectionChanged (const QCPDataSelection &selection) |
| void | selectableChanged (QCP::SelectionType selectable) |
| void | selectionChanged (bool selected) |
| void | selectableChanged (bool selectable) |
| Signals inherited from QCPLayerable | |
| void | layerChanged (QCPLayer *newLayer) |
| void | layerChanged (QCPLayer *newLayer) |
| Protected Types inherited from QCPAbstractPlottable | |
| enum | SignDomain { sdNegative , sdBoth , sdPositive } |
A plottable representing a financial stock chart.

This plottable represents time series data binned to certain intervals, mainly used for stock charts. The two common representations OHLC (Open-High-Low-Close) bars and Candlesticks can be set via setChartStyle.
The data is passed via setData as a set of open/high/low/close values at certain keys (typically times). This means the data must be already binned appropriately. If data is only available as a series of values (e.g. price against time), you can use the static convenience function timeSeriesToOhlc to generate binned OHLC-data which can then be passed to setData.
The width of the OHLC bars/candlesticks can be controlled with setWidth and setWidthType. A typical choice is to set the width type to wtPlotCoords (the default) and the width to (or slightly less than) one time bin interval width.
Charts can be either single- or two-colored (setTwoColored). If set to be single-colored, lines are drawn with the plottable's pen (setPen) and fills with the brush (setBrush).
If set to two-colored, positive changes of the value during an interval (close >= open) are represented with a different pen and brush than negative changes (close < open). These can be configured with setPenPositive, setPenNegative, setBrushPositive, and setBrushNegative. In two-colored mode, the normal plottable pen/brush is ignored. Upon selection however, the normal selected pen/brush (provided by the selectionDecorator) is used, irrespective of whether the chart is single- or two-colored.
Like all data representing objects in QCustomPlot, the QCPFinancial is a plottable (QCPAbstractPlottable). So the plottable-interface of QCustomPlot applies (QCustomPlot::plottable, QCustomPlot::removePlottable, etc.)
Usually, you first create an instance:
qcpfinancial-creation-1 which registers it with the QCustomPlot instance of the passed axes. Note that this QCustomPlot instance takes ownership of the plottable, so do not delete it manually but use QCustomPlot::removePlottable() instead. The newly created plottable can be modified, e.g.:
qcpfinancial-creation-2 Here we have used the static helper method timeSeriesToOhlc, to turn a time-price data series into a 24-hour binned open-high-low-close data series as QCPFinancial uses.
This plottable represents time series data binned to certain intervals, mainly used for stock charts. The two common representations OHLC (Open-High-Low-Close) bars and Candlesticks can be set via setChartStyle.
The data is passed via setData as a set of open/high/low/close values at certain keys (typically times). This means the data must be already binned appropriately. If data is only available as a series of values (e.g. price against time), you can use the static convenience function timeSeriesToOhlc to generate binned OHLC-data which can then be passed to setData.
The width of the OHLC bars/candlesticks can be controlled with setWidth and is given in plot key coordinates. A typical choice is to set it to (or slightly less than) one bin interval width.
Charts can be either single- or two-colored (setTwoColored). If set to be single-colored, lines are drawn with the plottable's pen (setPen) and fills with the brush (setBrush).
If set to two-colored, positive changes of the value during an interval (close >= open) are represented with a different pen and brush than negative changes (close < open). These can be configured with setPenPositive, setPenNegative, setBrushPositive, and setBrushNegative. In two-colored mode, the normal plottable pen/brush is ignored. Upon selection however, the normal selected pen/brush (setSelectedPen, setSelectedBrush) is used, irrespective of whether the chart is single- or two-colored.
Definition at line 6911 of file qcustomplot.h.
Defines the possible representations of OHLC data in the plot.
| Enumerator | |
|---|---|
| csOhlc | Open-High-Low-Close bar representation. |
| csCandlestick | Candlestick representation. |
| csOhlc | Open-High-Low-Close bar representation. |
| csCandlestick | Candlestick representation. |
Definition at line 6946 of file qcustomplot.h.
Defines the possible representations of OHLC data in the plot.
| Enumerator | |
|---|---|
| csOhlc | Open-High-Low-Close bar representation. |
| csCandlestick | Candlestick representation. |
| csOhlc | Open-High-Low-Close bar representation. |
| csCandlestick | Candlestick representation. |
Definition at line 3783 of file qcustomplot.h.
Defines the ways the width of the financial bar can be specified. Thus it defines what the number passed to setWidth actually means.
| Enumerator | |
|---|---|
| wtAbsolute | width is in absolute pixels |
| wtAxisRectRatio | width is given by a fraction of the axis rect size |
| wtPlotCoords | width is in key coordinates and thus scales with the key axis range |
Definition at line 6931 of file qcustomplot.h.
Constructs a financial chart which uses keyAxis as its key axis ("x") and valueAxis as its value axis ("y"). keyAxis and valueAxis must reside in the same QCustomPlot instance and not have the same orientation. If either of these restrictions is violated, a corresponding message is printed to the debug output (qDebug), the construction is not aborted, though.
The created QCPFinancial is automatically registered with the QCustomPlot instance inferred from keyAxis. This QCustomPlot instance takes ownership of the QCPFinancial, so do not delete it manually but use QCustomPlot::removePlottable() instead.
Constructs a financial chart which uses keyAxis as its key axis ("x") and valueAxis as its value axis ("y"). keyAxis and valueAxis must reside in the same QCustomPlot instance and not have the same orientation. If either of these restrictions is violated, a corresponding message is printed to the debug output (qDebug), the construction is not aborted, though.
The constructed QCPFinancial can be added to the plot with QCustomPlot::addPlottable, QCustomPlot then takes ownership of the financial chart.
Definition at line 28040 of file qcustomplot.cpp.
References QCPAbstractPlottable::mSelectionDecorator, and QCPSelectionDecorator::setBrush().
|
virtual |
Definition at line 28053 of file qcustomplot.cpp.
|
virtual |
| void QCPFinancial::addData | ( | const QCPFinancialData & | data | ) |
This is an overloaded member function, provided for convenience. It differs from the above function only in what argument(s) it accepts.
Adds the provided single data point in data to the current data.
Alternatively, you can also access and modify the data via the data method, which returns a pointer to the internal QCPFinancialData.
Definition at line 21967 of file qcustomplot.cpp.
References data(), mData, and qtCompatMapInsertMulti().
| void QCPFinancial::addData | ( | const QCPFinancialDataMap & | dataMap | ) |
Adds the provided data points in dataMap to the current data.
Alternatively, you can also access and modify the data via the data method, which returns a pointer to the internal QCPFinancialDataMap.
Definition at line 21954 of file qcustomplot.cpp.
References mData, and qtCompatMapUnite().
| void QCPFinancial::addData | ( | const QVector< double > & | key, |
| const QVector< double > & | open, | ||
| const QVector< double > & | high, | ||
| const QVector< double > & | low, | ||
| const QVector< double > & | close | ||
| ) |
This is an overloaded member function, provided for convenience. It differs from the above function only in what argument(s) it accepts.
Adds the provided open/high/low/close data to the current data.
Alternatively, you can also access and modify the data via the data method, which returns a pointer to the internal QCPFinancialData.
Definition at line 21996 of file qcustomplot.cpp.
References mData, and qtCompatMapInsertMulti().
| void QCPFinancial::addData | ( | const QVector< double > & | keys, |
| const QVector< double > & | open, | ||
| const QVector< double > & | high, | ||
| const QVector< double > & | low, | ||
| const QVector< double > & | close, | ||
| bool | alreadySorted = false |
||
| ) |
This is an overloaded member function, provided for convenience. It differs from the above function only in what argument(s) it accepts.
Adds the provided points in keys, open, high, low and close to the current data. The provided vectors should have equal length. Else, the number of added points will be the size of the smallest vector.
If you can guarantee that the passed data points are sorted by keys in ascending order, you can set alreadySorted to true, to improve performance by saving a sorting run.
Alternatively, you can also access and modify the data directly via the data method, which returns a pointer to the internal data container.
Definition at line 28204 of file qcustomplot.cpp.
References QCPAbstractPlottable1D< QCPFinancialData >::mDataContainer.
Referenced by setData().
| void QCPFinancial::addData | ( | double | key, |
| double | open, | ||
| double | high, | ||
| double | low, | ||
| double | close | ||
| ) |
This is an overloaded member function, provided for convenience. It differs from the above function only in what argument(s) it accepts.
Adds the provided data point as key, open, high, low and close to the current data.
Alternatively, you can also access and modify the data directly via the data method, which returns a pointer to the internal data container.
This is an overloaded member function, provided for convenience. It differs from the above function only in what argument(s) it accepts.
Adds the provided single data point given by key, open, high, low, and close to the current data.
Alternatively, you can also access and modify the data via the data method, which returns a pointer to the internal QCPFinancialData.
Definition at line 28248 of file qcustomplot.cpp.
References QCPAbstractPlottable1D< QCPFinancialData >::mDataContainer.
| void QCPFinancial::addData | ( | double | key, |
| double | open, | ||
| double | high, | ||
| double | low, | ||
| double | close | ||
| ) |
|
inline |
Definition at line 6965 of file qcustomplot.h.
|
inline |
Definition at line 3799 of file qcustomplot.h.
|
inline |
Definition at line 6964 of file qcustomplot.h.
|
inline |
Definition at line 3798 of file qcustomplot.h.
|
protected |
Definition at line 28824 of file qcustomplot.cpp.
References QCPRange::contains(), QCPAxis::coordToPixel(), QCPVector2D::distanceSquaredToLine(), QCPAbstractPlottable::keyAxis(), QCPAbstractPlottable1D< QCPFinancialData >::mDataContainer, QCPAbstractPlottable::mKeyAxis, QCPLayerable::mParentPlot, QCPAbstractPlottable::mValueAxis, mWidth, QCPAxis::orientation(), QCPAbstractPlottable::pixelsToCoords(), QCustomPlot::selectionTolerance(), and QCPAbstractPlottable::valueAxis().
Referenced by selectTest().
|
protected |
Definition at line 22597 of file qcustomplot.cpp.
References QCPRange::contains(), QCPAxis::coordToPixel(), QCPAbstractPlottable::distSqrToLine(), QCPAbstractPlottable::keyAxis(), QCPAbstractPlottable::mKeyAxis, QCPLayerable::mParentPlot, QCPAbstractPlottable::mValueAxis, mWidth, QCPAxis::orientation(), QCPAbstractPlottable::pixelsToCoords(), QCustomPlot::selectionTolerance(), and QCPAbstractPlottable::valueAxis().
|
inline |
Definition at line 6960 of file qcustomplot.h.
|
inline |
Definition at line 3795 of file qcustomplot.h.
|
virtual |
Removes all data points.
Implements QCPAbstractPlottable.
Definition at line 22064 of file qcustomplot.cpp.
References mData.
|
inline |
Returns a pointer to the internal data storage of type QCPFinancialDataContainer. You may use it to directly manipulate the data, which may be more convenient and faster than using the regular setData or addData methods, in certain situations.
Returns a pointer to the internal data storage of type QCPFinancialDataMap. You may use it to directly manipulate the data, which may be more convenient and faster than using the regular setData or addData methods, in certain situations.
Definition at line 6957 of file qcustomplot.h.
Referenced by addData(), setData(), and timeSeriesToOhlc().
|
inline |
Definition at line 3794 of file qcustomplot.h.
|
protectedvirtual |
Implements QCPAbstractPlottable.
Definition at line 28408 of file qcustomplot.cpp.
References csCandlestick, csOhlc, drawCandlestickPlot(), QCPSelectionDecorator::drawDecoration(), drawOhlcPlot(), QCPAbstractPlottable1D< QCPFinancialData >::getDataSegments(), getVisibleDataBounds(), mChartStyle, QCPAbstractPlottable1D< QCPFinancialData >::mDataContainer, QCPAbstractPlottable::mSelectionDecorator, and QCPAbstractPlottable::selection().
|
protectedvirtual |
Implements QCPAbstractPlottable.
|
protected |
Definition at line 28629 of file qcustomplot.cpp.
References QCPSelectionDecorator::applyBrush(), QCPSelectionDecorator::applyPen(), QCPAxis::coordToPixel(), QCPPainter::drawLine(), getPixelWidth(), QCPAbstractPlottable::keyAxis(), QCPAbstractPlottable::mBrush, mBrushNegative, mBrushPositive, QCPAbstractPlottable::mKeyAxis, QCPAbstractPlottable::mPen, mPenNegative, mPenPositive, QCPAbstractPlottable::mSelectionDecorator, mTwoColored, QCPAbstractPlottable::mValueAxis, QCPAxis::orientation(), QCPPainter::setPen(), and QCPAbstractPlottable::valueAxis().
Referenced by draw().
|
protected |
Definition at line 22445 of file qcustomplot.cpp.
References QCPAxis::coordToPixel(), QCPPainter::drawLine(), QCPAbstractPlottable::keyAxis(), QCPAbstractPlottable::mBrush, mBrushNegative, mBrushPositive, QCPAbstractPlottable::mKeyAxis, QCPAbstractPlottable::mPen, mPenNegative, mPenPositive, QCPAbstractPlottable::mSelected, QCPAbstractPlottable::mSelectedBrush, QCPAbstractPlottable::mSelectedPen, mTwoColored, QCPAbstractPlottable::mValueAxis, mWidth, QCPAxis::orientation(), QCPPainter::setPen(), and QCPAbstractPlottable::valueAxis().
|
protectedvirtual |
Implements QCPAbstractPlottable.
Definition at line 28443 of file qcustomplot.cpp.
References csCandlestick, csOhlc, QCPPainter::drawLine(), QCPAbstractPlottable::mBrush, mBrushNegative, mBrushPositive, mChartStyle, QCPAbstractPlottable::mPen, mPenNegative, mPenPositive, mTwoColored, QCPPainter::setAntialiasing(), and QCPPainter::setPen().
|
protectedvirtual |
Implements QCPAbstractPlottable.
|
protected |
Definition at line 28552 of file qcustomplot.cpp.
References QCPSelectionDecorator::applyPen(), QCPAxis::coordToPixel(), QCPPainter::drawLine(), getPixelWidth(), QCPAbstractPlottable::keyAxis(), QCPAbstractPlottable::mKeyAxis, QCPAbstractPlottable::mPen, mPenNegative, mPenPositive, QCPAbstractPlottable::mSelectionDecorator, mTwoColored, QCPAbstractPlottable::mValueAxis, QCPAxis::orientation(), QCPPainter::setPen(), and QCPAbstractPlottable::valueAxis().
Referenced by draw().
|
protected |
Definition at line 22361 of file qcustomplot.cpp.
References QCPAxis::coordToPixel(), QCPPainter::drawLine(), QCPAbstractPlottable::keyAxis(), QCPAbstractPlottable::mKeyAxis, QCPAbstractPlottable::mPen, mPenNegative, mPenPositive, QCPAbstractPlottable::mSelected, QCPAbstractPlottable::mSelectedPen, mTwoColored, QCPAbstractPlottable::mValueAxis, mWidth, QCPAxis::orientation(), QCPPainter::setPen(), and QCPAbstractPlottable::valueAxis().
|
virtual |
Returns the coordinate range that all data in this plottable span in the key axis dimension. For logarithmic plots, one can set inSignDomain to either QCP::sdNegative or QCP::sdPositive in order to restrict the returned range to that sign domain. E.g. when only negative range is wanted, set inSignDomain to QCP::sdNegative and all positive points will be ignored for range calculation. For no restriction, just set inSignDomain to QCP::sdBoth (default). foundRange is an output parameter that indicates whether a range could be found or not. If this is false, you shouldn't use the returned range (e.g. no points in data).
Note that foundRange is not the same as QCPRange::validRange, since the range returned by this function may have size zero (e.g. when there is only one data point). In this case foundRange would return true, but the returned range is not a valid range in terms of QCPRange::validRange.
Implements QCPAbstractPlottable.
Definition at line 28326 of file qcustomplot.cpp.
References QCPRange::lower, QCPAbstractPlottable1D< QCPFinancialData >::mDataContainer, mWidth, QCP::sdNegative, QCP::sdPositive, and QCPRange::upper.
|
protectedvirtual |
Implements QCPAbstractPlottable.
Definition at line 22280 of file qcustomplot.cpp.
References QCPRange::lower, mData, QCPAbstractPlottable::mKeyAxis, mWidth, QCPAbstractPlottable::sdBoth, QCPAbstractPlottable::sdNegative, QCPAbstractPlottable::sdPositive, and QCPRange::upper.
|
protected |
Definition at line 28727 of file qcustomplot.cpp.
References QCPAbstractPlottable::mKeyAxis, mWidth, mWidthType, result, wtAbsolute, wtAxisRectRatio, and wtPlotCoords.
Referenced by drawCandlestickPlot(), and drawOhlcPlot().
|
virtual |
Returns the coordinate range that the data points in the specified key range (inKeyRange) span in the value axis dimension. For logarithmic plots, one can set inSignDomain to either QCP::sdNegative or QCP::sdPositive in order to restrict the returned range to that sign domain. E.g. when only negative range is wanted, set inSignDomain to QCP::sdNegative and all positive points will be ignored for range calculation. For no restriction, just set inSignDomain to QCP::sdBoth (default). foundRange is an output parameter that indicates whether a range could be found or not. If this is false, you shouldn't use the returned range (e.g. no points in data).
If inKeyRange has both lower and upper bound set to zero (is equal to QCPRange()), all data points are considered, without any restriction on the keys.
Note that foundRange is not the same as QCPRange::validRange, since the range returned by this function may have size zero (e.g. when there is only one data point). In this case foundRange would return true, but the returned range is not a valid range in terms of QCPRange::validRange.
Implements QCPAbstractPlottable.
Definition at line 28340 of file qcustomplot.cpp.
References QCPAbstractPlottable1D< QCPFinancialData >::mDataContainer.
|
protectedvirtual |
called by rescaleAxes functions to get the full data value bounds. For logarithmic plots, one can set inSignDomain to either sdNegative or sdPositive in order to restrict the returned range to that sign domain. E.g. when only negative range is wanted, set inSignDomain to sdNegative and all positive points will be ignored for range calculation. For no restriction, just set inSignDomain to sdBoth (default). foundRange is an output parameter that indicates whether a range could be found or not. If this is false, you shouldn't use the returned range (e.g. no points in data).
Note that foundRange is not the same as QCPRange::validRange, since the range returned by this function may have size zero, which wouldn't count as a valid range.
Implements QCPAbstractPlottable.
Definition at line 22312 of file qcustomplot.cpp.
References QCPRange::lower, mData, QCPAbstractPlottable::sdBoth, QCPAbstractPlottable::sdNegative, QCPAbstractPlottable::sdPositive, and QCPRange::upper.
|
protected |
Definition at line 28930 of file qcustomplot.cpp.
References QCPAbstractPlottable1D< QCPFinancialData >::mDataContainer, QCPAbstractPlottable::mKeyAxis, and mWidth.
Referenced by draw(), selectTest(), and selectTestRect().
|
protected |
Definition at line 22703 of file qcustomplot.cpp.
References mData, and QCPAbstractPlottable::mKeyAxis.
|
protected |
Definition at line 28769 of file qcustomplot.cpp.
References QCPAxis::coordToPixel(), QCPVector2D::distanceSquaredToLine(), QCPAbstractPlottable::keyAxis(), QCPAbstractPlottable1D< QCPFinancialData >::mDataContainer, QCPAbstractPlottable::mKeyAxis, QCPAbstractPlottable::mValueAxis, QCPAxis::orientation(), and QCPAbstractPlottable::valueAxis().
Referenced by selectTest().
|
protected |
Definition at line 22553 of file qcustomplot.cpp.
References QCPAxis::coordToPixel(), QCPAbstractPlottable::distSqrToLine(), QCPAbstractPlottable::keyAxis(), QCPAbstractPlottable::mKeyAxis, QCPAbstractPlottable::mValueAxis, QCPAxis::orientation(), and QCPAbstractPlottable::valueAxis().
|
inline |
Definition at line 6967 of file qcustomplot.h.
|
inline |
Definition at line 3801 of file qcustomplot.h.
|
inline |
Definition at line 6966 of file qcustomplot.h.
|
inline |
Definition at line 3800 of file qcustomplot.h.
| void QCPFinancial::removeData | ( | double | fromKey, |
| double | toKey | ||
| ) |
Removes all data points with keys between fromKey and toKey. if fromKey is greater or equal to toKey, the function does nothing. To remove a single data point with known key, use removeData(double key).
Definition at line 22041 of file qcustomplot.cpp.
References mData.
| void QCPFinancial::removeData | ( | double | key | ) |
This is an overloaded member function, provided for convenience. It differs from the above function only in what argument(s) it accepts.
Removes a single data point at key. If the position is not known with absolute precision, consider using removeData(double fromKey, double toKey) with a small fuzziness interval around the suspected position, depeding on the precision with which the key is known.
Definition at line 22057 of file qcustomplot.cpp.
References mData.
| void QCPFinancial::removeDataAfter | ( | double | key | ) |
Removes all data points with keys greater than key.
Definition at line 22028 of file qcustomplot.cpp.
References mData.
| void QCPFinancial::removeDataBefore | ( | double | key | ) |
Removes all data points with keys smaller than key.
Definition at line 22018 of file qcustomplot.cpp.
References mData.
|
protected |
Definition at line 28955 of file qcustomplot.cpp.
References QCPAxis::coordToPixel(), QCPAbstractPlottable::keyAxis(), QCPAbstractPlottable::mKeyAxis, QCPAbstractPlottable::mValueAxis, mWidth, QCPAxis::orientation(), and QCPAbstractPlottable::valueAxis().
Referenced by selectTestRect().
|
virtual |
Implements a selectTest specific to this plottable's point geometry.
If details is not 0, it will be set to a QCPDataSelection, describing the closest data point to pos.
\seebaseclassmethod QCPAbstractPlottable::selectTest
Implements QCPAbstractPlottable.
Definition at line 28287 of file qcustomplot.cpp.
References candlestickSelectTest(), csCandlestick, csOhlc, getVisibleDataBounds(), mChartStyle, QCPAbstractPlottable1D< QCPFinancialData >::mDataContainer, QCPAbstractPlottable::mKeyAxis, QCPAbstractPlottable::mSelectable, QCPAbstractPlottable::mValueAxis, ohlcSelectTest(), result, and QCP::stNone.
|
virtual |
This function is used to decide whether a click hits a layerable object or not.
pos is a point in pixel coordinates on the QCustomPlot surface. This function returns the shortest pixel distance of this point to the object. If the object is either invisible or the distance couldn't be determined, -1.0 is returned. Further, if onlySelectable is true and the object is not selectable, -1.0 is returned, too.
If the object is represented not by single lines but by an area like a QCPItemText or the bars of a QCPBars plottable, a click inside the area should also be considered a hit. In these cases this function thus returns a constant value greater zero but still below the parent plot's selection tolerance. (typically the selectionTolerance multiplied by 0.99).
Providing a constant value for area objects allows selecting line objects even when they are obscured by such area objects, by clicking close to the lines (i.e. closer than 0.99*selectionTolerance).
The actual setting of the selection state is not done by this function. This is handled by the parent QCustomPlot when the mouseReleaseEvent occurs, and the finally selected object is notified via the selectEvent/ deselectEvent methods.
details is an optional output parameter. Every layerable subclass may place any information in details. This information will be passed to selectEvent when the parent QCustomPlot decides on the basis of this selectTest call, that the object was successfully selected. The subsequent call to selectEvent will carry the details. This is useful for multi-part objects (like QCPAxis). This way, a possibly complex calculation to decide which part was clicked is only done once in selectTest. The result (i.e. the actually clicked part) can then be placed in details. So in the subsequent selectEvent, the decision which part was selected doesn't have to be done a second time for a single selection operation.
In the case of 1D Plottables (QCPAbstractPlottable1D, like QCPGraph or QCPBars) details will be set to a QCPDataSelection, describing the closest data point to pos.
You may pass 0 as details to indicate that you are not interested in those selection details.
This function is used to decide whether a click hits a layerable object or not.
pos is a point in pixel coordinates on the QCustomPlot surface. This function returns the shortest pixel distance of this point to the object. If the object is either invisible or the distance couldn't be determined, -1.0 is returned. Further, if onlySelectable is true and the object is not selectable, -1.0 is returned, too.
If the object is represented not by single lines but by an area like a QCPItemText or the bars of a QCPBars plottable, a click inside the area should also be considered a hit. In these cases this function thus returns a constant value greater zero but still below the parent plot's selection tolerance. (typically the selectionTolerance multiplied by 0.99).
Providing a constant value for area objects allows selecting line objects even when they are obscured by such area objects, by clicking close to the lines (i.e. closer than 0.99*selectionTolerance).
The actual setting of the selection state is not done by this function. This is handled by the parent QCustomPlot when the mouseReleaseEvent occurs, and the finally selected object is notified via the selectEvent/deselectEvent methods.
details is an optional output parameter. Every layerable subclass may place any information in details. This information will be passed to selectEvent when the parent QCustomPlot decides on the basis of this selectTest call, that the object was successfully selected. The subsequent call to selectEvent will carry the details. This is useful for multi-part objects (like QCPAxis). This way, a possibly complex calculation to decide which part was clicked is only done once in selectTest. The result (i.e. the actually clicked part) can then be placed in details. So in the subsequent selectEvent, the decision which part was selected doesn't have to be done a second time for a single selection operation.
You may pass 0 as details to indicate that you are not interested in those selection details.
Implements QCPAbstractPlottable.
|
virtual |
Returns a data selection containing all the data points of this plottable which are contained (or hit by) rect. This is used mainly in the selection rect interaction for data selection (data selectionmechanism").
If onlySelectable is true, an empty QCPDataSelection is returned if this plottable is not selectable (i.e. if QCPAbstractPlottable::setSelectable is QCP::stNone).
QRect::normalized() when passing a rect which might not be normalized. Reimplemented from QCPAbstractPlottable1D< QCPFinancialData >.
Definition at line 28256 of file qcustomplot.cpp.
References getVisibleDataBounds(), QCPAbstractPlottable1D< QCPFinancialData >::mDataContainer, QCPAbstractPlottable::mKeyAxis, QCPAbstractPlottable::mSelectable, QCPAbstractPlottable::mValueAxis, result, selectionHitBox(), and QCP::stNone.
| void QCPFinancial::setBrushNegative | ( | const QBrush & | brush | ) |
If setTwoColored is set to true, this function controls the brush that is used to draw fills of data points with a negative trend (i.e. bars/candlesticks with close < open).
If twoColored is false, the normal plottable's pen and brush are used (setPen, setBrush).
Definition at line 28161 of file qcustomplot.cpp.
References QCPAbstractPlottable::brush(), and mBrushNegative.
| void QCPFinancial::setBrushNegative | ( | const QBrush & | brush | ) |
| void QCPFinancial::setBrushPositive | ( | const QBrush & | brush | ) |
If setTwoColored is set to true, this function controls the brush that is used to draw fills of data points with a positive trend (i.e. bars/candlesticks with close >= open).
If twoColored is false, the normal plottable's pen and brush are used (setPen, setBrush).
Definition at line 28147 of file qcustomplot.cpp.
References QCPAbstractPlottable::brush(), and mBrushPositive.
| void QCPFinancial::setBrushPositive | ( | const QBrush & | brush | ) |
| void QCPFinancial::setChartStyle | ( | QCPFinancial::ChartStyle | style | ) |
Sets which representation style shall be used to display the OHLC data.
Definition at line 28101 of file qcustomplot.cpp.
References mChartStyle.
| void QCPFinancial::setChartStyle | ( | ChartStyle | style | ) |
| void QCPFinancial::setData | ( | const QVector< double > & | key, |
| const QVector< double > & | open, | ||
| const QVector< double > & | high, | ||
| const QVector< double > & | low, | ||
| const QVector< double > & | close | ||
| ) |
This is an overloaded member function, provided for convenience. It differs from the above function only in what argument(s) it accepts.
Replaces the current data with the provided open/high/low/close data. The provided vectors should have equal length. Else, the number of added points will be the size of the smallest vector.
Definition at line 21849 of file qcustomplot.cpp.
References mData, and qtCompatMapInsertMulti().
| void QCPFinancial::setData | ( | const QVector< double > & | keys, |
| const QVector< double > & | open, | ||
| const QVector< double > & | high, | ||
| const QVector< double > & | low, | ||
| const QVector< double > & | close, | ||
| bool | alreadySorted = false |
||
| ) |
This is an overloaded member function, provided for convenience. It differs from the above function only in what argument(s) it accepts.
Replaces the current data with the provided points in keys, open, high, low and close. The provided vectors should have equal length. Else, the number of added points will be the size of the smallest vector.
If you can guarantee that the passed data points are sorted by keys in ascending order, you can set alreadySorted to true, to improve performance by saving a sorting run.
Definition at line 28088 of file qcustomplot.cpp.
References addData(), and QCPAbstractPlottable1D< QCPFinancialData >::mDataContainer.
| void QCPFinancial::setData | ( | QCPFinancialDataMap * | data, |
| bool | copy = false |
||
| ) |
Replaces the current data with the provided data.
If copy is set to true, data points in data will only be copied. if false, the plottable takes ownership of the passed data and replaces the internal data pointer with it. This is significantly faster than copying for large datasets.
Alternatively, you can also access and modify the plottable's data via the data method, which returns a pointer to the internal QCPFinancialDataMap.
Definition at line 21825 of file qcustomplot.cpp.
| void QCPFinancial::setData | ( | QSharedPointer< QCPFinancialDataContainer > | data | ) |
This is an overloaded member function, provided for convenience. It differs from the above function only in what argument(s) it accepts.
Replaces the current data container with the provided data container.
Since a QSharedPointer is used, multiple QCPFinancials may share the same data container safely. Modifying the data in the container will then affect all financials that share the container. Sharing can be achieved by simply exchanging the data containers wrapped in shared pointers:
If you do not wish to share containers, but create a copy from an existing container, rather use the QCPDataContainer<DataType>::set method on the financial's data container directly:
Definition at line 28072 of file qcustomplot.cpp.
References data(), and QCPAbstractPlottable1D< QCPFinancialData >::mDataContainer.
| void QCPFinancial::setPenNegative | ( | const QPen & | pen | ) |
If setTwoColored is set to true, this function controls the pen that is used to draw outlines of data points with a negative trend (i.e. bars/candlesticks with close < open).
If twoColored is false, the normal plottable's pen and brush are used (setPen, setBrush).
Definition at line 28187 of file qcustomplot.cpp.
References mPenNegative, and QCPAbstractPlottable::pen().
| void QCPFinancial::setPenNegative | ( | const QPen & | pen | ) |
| void QCPFinancial::setPenPositive | ( | const QPen & | pen | ) |
If setTwoColored is set to true, this function controls the pen that is used to draw outlines of data points with a positive trend (i.e. bars/candlesticks with close >= open).
If twoColored is false, the normal plottable's pen and brush are used (setPen, setBrush).
Definition at line 28175 of file qcustomplot.cpp.
References mPenPositive, and QCPAbstractPlottable::pen().
| void QCPFinancial::setPenPositive | ( | const QPen & | pen | ) |
| void QCPFinancial::setTwoColored | ( | bool | twoColored | ) |
Sets whether this chart shall contrast positive from negative trends per data point by using two separate colors to draw the respective bars/candlesticks.
If twoColored is false, the normal plottable's pen and brush are used (setPen, setBrush).
Definition at line 28135 of file qcustomplot.cpp.
References mTwoColored, and twoColored().
| void QCPFinancial::setTwoColored | ( | bool | twoColored | ) |
| void QCPFinancial::setWidth | ( | double | width | ) |
Sets the width of the individual bars/candlesticks to width in plot key coordinates.
A typical choice is to set it to (or slightly less than) one bin interval width.
Definition at line 28112 of file qcustomplot.cpp.
| void QCPFinancial::setWidth | ( | double | width | ) |
| void QCPFinancial::setWidthType | ( | QCPFinancial::WidthType | widthType | ) |
Sets how the width of the financial bars is defined. See the documentation of WidthType for an explanation of the possible values for widthType.
The default value is wtPlotCoords.
Definition at line 28122 of file qcustomplot.cpp.
References mWidthType, and widthType().
|
static |
A convenience function that converts time series data (value against time) to OHLC binned data points. The return value can then be passed on to QCPFinancialDataContainer::set(const QCPFinancialDataContainer&).
The size of the bins can be controlled with timeBinSize in the same units as time is given. For example, if the unit of time is seconds and single OHLC/Candlesticks should span an hour each, set timeBinSize to 3600.
timeBinOffset allows to control precisely at what time coordinate a bin should start. The value passed as timeBinOffset doesn't need to be in the range encompassed by the time keys. It merely defines the mathematical offset/phase of the bins that will be used to process the data.
A convenience function that converts time series data (value against time) to OHLC binned data points. The return value can then be passed on to setData.
The size of the bins can be controlled with timeBinSize in the same units as time is given. For example, if the unit of time is seconds and single OHLC/Candlesticks should span an hour each, set timeBinSize to 3600.
timeBinOffset allows to control precisely at what time coordinate a bin should start. The value passed as timeBinOffset doesn't need to be in the range encompassed by the time keys. It merely defines the mathematical offset/phase of the bins that will be used to process the data.
Definition at line 28360 of file qcustomplot.cpp.
References QCPFinancialData::close, count, data(), QCPFinancialData::high, QCPFinancialData::key, QCPFinancialData::low, and QCPFinancialData::open.
|
static |
|
inline |
Definition at line 6963 of file qcustomplot.h.
Referenced by setTwoColored().
|
inline |
Definition at line 3797 of file qcustomplot.h.
|
inline |
Definition at line 6961 of file qcustomplot.h.
Referenced by setWidth().
|
inline |
Definition at line 3796 of file qcustomplot.h.
|
inline |
Definition at line 6962 of file qcustomplot.h.
Referenced by setWidthType().
|
protected |
Definition at line 7023 of file qcustomplot.h.
Referenced by drawCandlestickPlot(), drawLegendIcon(), and setBrushNegative().
|
protected |
Definition at line 7023 of file qcustomplot.h.
Referenced by drawCandlestickPlot(), drawLegendIcon(), and setBrushPositive().
|
protected |
Definition at line 7019 of file qcustomplot.h.
Referenced by draw(), drawLegendIcon(), selectTest(), and setChartStyle().
|
protected |
Definition at line 3847 of file qcustomplot.h.
Referenced by addData(), clearData(), getKeyRange(), getValueRange(), getVisibleDataBounds(), removeData(), removeDataAfter(), removeDataBefore(), and setData().
|
protected |
Definition at line 7024 of file qcustomplot.h.
Referenced by drawCandlestickPlot(), drawLegendIcon(), drawOhlcPlot(), and setPenNegative().
|
protected |
Definition at line 7024 of file qcustomplot.h.
Referenced by drawCandlestickPlot(), drawLegendIcon(), drawOhlcPlot(), and setPenPositive().
|
protected |
Definition at line 7022 of file qcustomplot.h.
Referenced by drawCandlestickPlot(), drawLegendIcon(), drawOhlcPlot(), and setTwoColored().
|
protected |
Definition at line 7020 of file qcustomplot.h.
Referenced by candlestickSelectTest(), drawCandlestickPlot(), drawOhlcPlot(), getKeyRange(), getPixelWidth(), getVisibleDataBounds(), selectionHitBox(), and setWidth().
|
protected |
Definition at line 7021 of file qcustomplot.h.
Referenced by getPixelWidth(), and setWidthType().