|
ACloudViewer
3.9.4
A Modern Library for 3D Data Processing
|
|
ACloudViewer
3.9.4
A Modern Library for 3D Data Processing
|
A color scale for use with color coding data such as QCPColorMap. More...
#include <qcustomplot.h>
Signals | |
| void | dataRangeChanged (const QCPRange &newRange) |
| void | dataScaleTypeChanged (QCPAxis::ScaleType scaleType) |
| void | gradientChanged (const QCPColorGradient &newGradient) |
| void | dataRangeChanged (QCPRange newRange) |
| void | dataScaleTypeChanged (QCPAxis::ScaleType scaleType) |
| void | gradientChanged (QCPColorGradient newGradient) |
 Signals inherited from QCPLayerable Signals inherited from QCPLayerable | |
| void | layerChanged (QCPLayer *newLayer) |
| void | layerChanged (QCPLayer *newLayer) |
Public Member Functions | |
| QCPColorScale (QCustomPlot *parentPlot) | |
| virtual | ~QCPColorScale () |
| QCPAxis * | axis () const |
| QCPAxis::AxisType | type () const |
| QCPRange | dataRange () const |
| QCPAxis::ScaleType | dataScaleType () const |
| QCPColorGradient | gradient () const |
| QString | label () const |
| int | barWidth () const |
| bool | rangeDrag () const |
| bool | rangeZoom () const |
| void | setType (QCPAxis::AxisType type) |
| Q_SLOT void | setDataRange (const QCPRange &dataRange) |
| Q_SLOT void | setDataScaleType (QCPAxis::ScaleType scaleType) |
| Q_SLOT void | setGradient (const QCPColorGradient &gradient) |
| void | setLabel (const QString &str) |
| void | setBarWidth (int width) |
| void | setRangeDrag (bool enabled) |
| void | setRangeZoom (bool enabled) |
| QList< QCPColorMap * > | colorMaps () const |
| void | rescaleDataRange (bool onlyVisibleMaps) |
| virtual void | update (UpdatePhase phase) |
| Public Member Functions inherited from QCPLayoutElement | |
| QCPLayoutElement (QCustomPlot *parentPlot=0) | |
| virtual | ~QCPLayoutElement () |
| QCPLayout * | layout () const |
| QRect | rect () const |
| QRect | outerRect () const |
| QMargins | margins () const |
| QMargins | minimumMargins () const |
| QCP::MarginSides | autoMargins () const |
| QSize | minimumSize () const |
| QSize | maximumSize () const |
| SizeConstraintRect | sizeConstraintRect () const |
| QCPMarginGroup * | marginGroup (QCP::MarginSide side) const |
| QHash< QCP::MarginSide, QCPMarginGroup * > | marginGroups () const |
| void | setOuterRect (const QRect &rect) |
| void | setMargins (const QMargins &margins) |
| void | setMinimumMargins (const QMargins &margins) |
| void | setAutoMargins (QCP::MarginSides sides) |
| void | setMinimumSize (const QSize &size) |
| void | setMinimumSize (int width, int height) |
| void | setMaximumSize (const QSize &size) |
| void | setMaximumSize (int width, int height) |
| void | setSizeConstraintRect (SizeConstraintRect constraintRect) |
| void | setMarginGroup (QCP::MarginSides sides, QCPMarginGroup *group) |
| virtual QSize | minimumOuterSizeHint () const |
| virtual QSize | maximumOuterSizeHint () const |
| virtual QList< QCPLayoutElement * > | elements (bool recursive) const |
| virtual double | selectTest (const QPointF &pos, bool onlySelectable, QVariant *details=0) const |
| QCPLayoutElement (QCustomPlot *parentPlot=0) | |
| virtual | ~QCPLayoutElement () |
| QCPLayout * | layout () const |
| QRect | rect () const |
| QRect | outerRect () const |
| QMargins | margins () const |
| QMargins | minimumMargins () const |
| QCP::MarginSides | autoMargins () const |
| QSize | minimumSize () const |
| QSize | maximumSize () const |
| QCPMarginGroup * | marginGroup (QCP::MarginSide side) const |
| QHash< QCP::MarginSide, QCPMarginGroup * > | marginGroups () const |
| void | setOuterRect (const QRect &rect) |
| void | setMargins (const QMargins &margins) |
| void | setMinimumMargins (const QMargins &margins) |
| void | setAutoMargins (QCP::MarginSides sides) |
| void | setMinimumSize (const QSize &size) |
| void | setMinimumSize (int width, int height) |
| void | setMaximumSize (const QSize &size) |
| void | setMaximumSize (int width, int height) |
| void | setMarginGroup (QCP::MarginSides sides, QCPMarginGroup *group) |
| virtual QSize | minimumSizeHint () const |
| virtual QSize | maximumSizeHint () const |
| virtual QList< QCPLayoutElement * > | elements (bool recursive) const |
| virtual double | selectTest (const QPointF &pos, bool onlySelectable, QVariant *details=0) const |
| Public Member Functions inherited from QCPLayerable | |
| QCPLayerable (QCustomPlot *plot, QString targetLayer=QString(), QCPLayerable *parentLayerable=0) | |
| virtual | ~QCPLayerable () |
| bool | visible () const |
| QCustomPlot * | parentPlot () const |
| QCPLayerable * | parentLayerable () const |
| QCPLayer * | layer () const |
| bool | antialiased () const |
| void | setVisible (bool on) |
| Q_SLOT bool | setLayer (QCPLayer *layer) |
| bool | setLayer (const QString &layerName) |
| void | setAntialiased (bool enabled) |
| bool | realVisibility () const |
| QCPLayerable (QCustomPlot *plot, QString targetLayer=QString(), QCPLayerable *parentLayerable=0) | |
| ~QCPLayerable () | |
| bool | visible () const |
| QCustomPlot * | parentPlot () const |
| QCPLayerable * | parentLayerable () const |
| QCPLayer * | layer () const |
| bool | antialiased () const |
| void | setVisible (bool on) |
| Q_SLOT bool | setLayer (QCPLayer *layer) |
| bool | setLayer (const QString &layerName) |
| void | setAntialiased (bool enabled) |
| bool | realVisibility () const |
Protected Member Functions | |
| virtual void | applyDefaultAntialiasingHint (QCPPainter *painter) const |
| virtual void | mousePressEvent (QMouseEvent *event, const QVariant &details) |
| virtual void | mouseMoveEvent (QMouseEvent *event, const QPointF &startPos) |
| virtual void | mouseReleaseEvent (QMouseEvent *event, const QPointF &startPos) |
| virtual void | wheelEvent (QWheelEvent *event) |
| virtual void | applyDefaultAntialiasingHint (QCPPainter *painter) const |
| virtual void | mousePressEvent (QMouseEvent *event) |
| virtual void | mouseMoveEvent (QMouseEvent *event) |
| virtual void | mouseReleaseEvent (QMouseEvent *event) |
| virtual void | wheelEvent (QWheelEvent *event) |
| Protected Member Functions inherited from QCPLayoutElement | |
| virtual int | calculateAutoMargin (QCP::MarginSide side) |
| virtual void | layoutChanged () |
| virtual void | draw (QCPPainter *painter) |
| virtual void | parentPlotInitialized (QCustomPlot *parentPlot) |
| virtual int | calculateAutoMargin (QCP::MarginSide side) |
| virtual void | mouseDoubleClickEvent (QMouseEvent *event) |
| virtual void | draw (QCPPainter *painter) |
| virtual void | parentPlotInitialized (QCustomPlot *parentPlot) |
| Protected Member Functions inherited from QCPLayerable | |
| virtual QCP::Interaction | selectionCategory () const |
| virtual QRect | clipRect () const |
| virtual void | selectEvent (QMouseEvent *event, bool additive, const QVariant &details, bool *selectionStateChanged) |
| virtual void | deselectEvent (bool *selectionStateChanged) |
| virtual void | mouseDoubleClickEvent (QMouseEvent *event, const QVariant &details) |
| void | initializeParentPlot (QCustomPlot *parentPlot) |
| void | setParentLayerable (QCPLayerable *parentLayerable) |
| bool | moveToLayer (QCPLayer *layer, bool prepend) |
| void | applyAntialiasingHint (QCPPainter *painter, bool localAntialiased, QCP::AntialiasedElement overrideElement) const |
| virtual QCP::Interaction | selectionCategory () const |
| virtual QRect | clipRect () const |
| virtual void | selectEvent (QMouseEvent *event, bool additive, const QVariant &details, bool *selectionStateChanged) |
| virtual void | deselectEvent (bool *selectionStateChanged) |
| void | initializeParentPlot (QCustomPlot *parentPlot) |
| void | setParentLayerable (QCPLayerable *parentLayerable) |
| bool | moveToLayer (QCPLayer *layer, bool prepend) |
| void | applyAntialiasingHint (QCPPainter *painter, bool localAntialiased, QCP::AntialiasedElement overrideElement) const |
Protected Attributes | |
| QCPAxis::AxisType | mType |
| QCPRange | mDataRange |
| QCPAxis::ScaleType | mDataScaleType |
| QCPColorGradient | mGradient |
| int | mBarWidth |
| QPointer< QCPColorScaleAxisRectPrivate > | mAxisRect |
| QPointer< QCPAxis > | mColorAxis |
| Protected Attributes inherited from QCPLayoutElement | |
| QCPLayout * | mParentLayout |
| QSize | mMinimumSize |
| QSize | mMaximumSize |
| SizeConstraintRect | mSizeConstraintRect |
| QRect | mRect |
| QRect | mOuterRect |
| QMargins | mMargins |
| QMargins | mMinimumMargins |
| QCP::MarginSides | mAutoMargins |
| QHash< QCP::MarginSide, QCPMarginGroup * > | mMarginGroups |
| Protected Attributes inherited from QCPLayerable | |
| bool | mVisible |
| QCustomPlot * | mParentPlot |
| QPointer< QCPLayerable > | mParentLayerable |
| QCPLayer * | mLayer |
| bool | mAntialiased |
Additional Inherited Members | |
| Public Types inherited from QCPLayoutElement | |
| enum | UpdatePhase { upPreparation , upMargins , upLayout , upPreparation , upMargins , upLayout } |
| enum | SizeConstraintRect { scrInnerRect , scrOuterRect } |
| enum | UpdatePhase { upPreparation , upMargins , upLayout , upPreparation , upMargins , upLayout } |
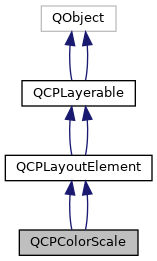
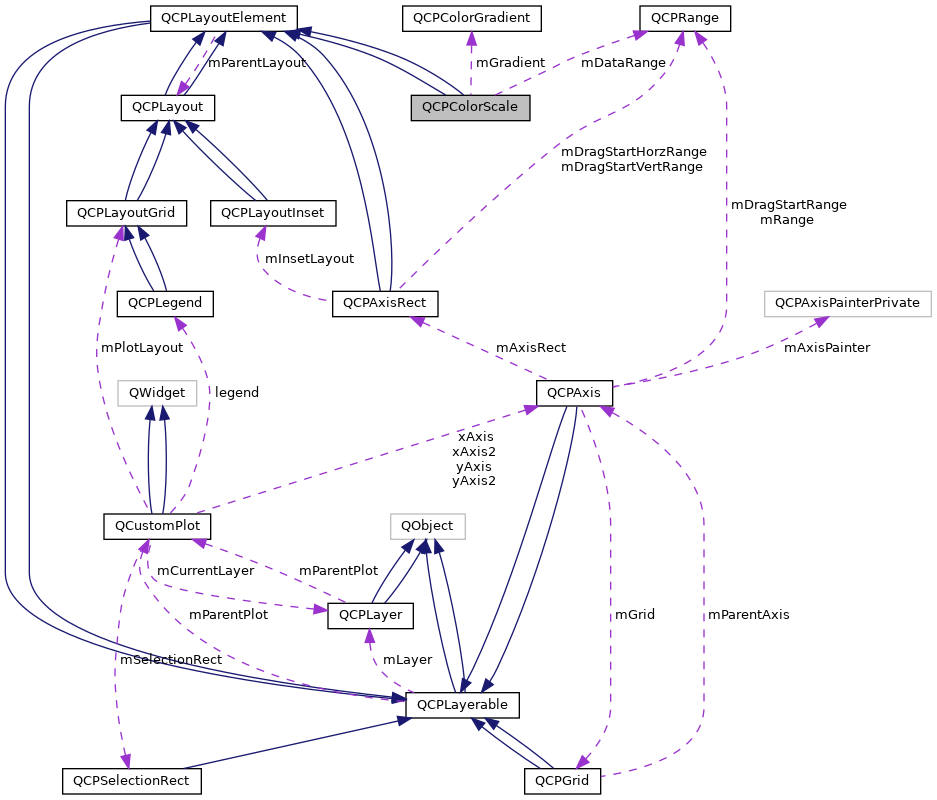
A color scale for use with color coding data such as QCPColorMap.
This layout element can be placed on the plot to correlate a color gradient with data values. It is usually used in combination with one or multiple QCPColorMaps.

The color scale can be either horizontal or vertical, as shown in the image above. The orientation and the side where the numbers appear is controlled with setType.
Use QCPColorMap::setColorScale to connect a color map with a color scale. Once they are connected, they share their gradient, data range and data scale type (setGradient, setDataRange, setDataScaleType). Multiple color maps may be associated with a single color scale, to make them all synchronize these properties.
To have finer control over the number display and axis behaviour, you can directly access the axis. See the documentation of QCPAxis for details about configuring axes. For example, if you want to change the number of automatically generated ticks, call
Placing a color scale next to the main axis rect works like with any other layout element:
qcpcolorscale-creation In this case we have placed it to the right of the default axis rect, so it wasn't necessary to call setType, since QCPAxis::atRight is already the default. The text next to the color scale can be set with setLabel.
For optimum appearance (like in the image above), it may be desirable to line up the axis rect and the borders of the color scale. Use a QCPMarginGroup to achieve this:
qcpcolorscale-margingroup
Color scales are initialized with a non-zero minimum top and bottom margin (setMinimumMargins), because vertical color scales are most common and the minimum top/bottom margin makes sure it keeps some distance to the top/bottom widget border. So if you change to a horizontal color scale by setting setType to QCPAxis::atBottom or QCPAxis::atTop, you might want to also change the minimum margins accordingly, e.g. setMinimumMargins(QMargins(6, 0, 6, 0)).
This layout element can be placed on the plot to correlate a color gradient with data values. It is usually used in combination with one or multiple QCPColorMaps.
The color scale can be either horizontal or vertical, as shown in the image above. The orientation and the side where the numbers appear is controlled with setType.
Use QCPColorMap::setColorScale to connect a color map with a color scale. Once they are connected, they share their gradient, data range and data scale type (setGradient, setDataRange, setDataScaleType). Multiple color maps may be associated with a single color scale, to make them all synchronize these properties.
To have finer control over the number display and axis behaviour, you can directly access the axis. See the documentation of QCPAxis for details about configuring axes. For example, if you want to change the number of automatically generated ticks, call
Placing a color scale next to the main axis rect works like with any other layout element:
qcpcolorscale-creation In this case we have placed it to the right of the default axis rect, so it wasn't necessary to call setType, since QCPAxis::atRight is already the default. The text next to the color scale can be set with setLabel.
For optimum appearance (like in the image above), it may be desirable to line up the axis rect and the borders of the color scale. Use a QCPMarginGroup to achieve this:
qcpcolorscale-margingroup
Color scales are initialized with a non-zero minimum top and bottom margin (setMinimumMargins), because vertical color scales are most common and the minimum top/bottom margin makes sure it keeps some distance to the top/bottom widget border. So if you change to a horizontal color scale by setting setType to QCPAxis::atBottom or QCPAxis::atTop, you might want to also change the minimum margins accordingly, e.g. setMinimumMargins(QMargins(6, 0, 6, 0)).
Definition at line 5876 of file qcustomplot.h.
|
explicit |
Constructs a new QCPColorScale.
Definition at line 20058 of file qcustomplot.cpp.
References QCPAxis::atRight, setDataRange(), QCPLayoutElement::setMinimumMargins(), and setType().
|
virtual |
Definition at line 20074 of file qcustomplot.cpp.
References mAxisRect.
|
explicit |
|
virtual |
|
protectedvirtual |
Reimplemented from QCPLayoutElement.
Definition at line 20423 of file qcustomplot.cpp.
References QCPPainter::setAntialiasing().
|
protectedvirtual |
Reimplemented from QCPLayoutElement.
|
inline |
Returns the internal QCPAxis instance of this color scale. You can access it to alter the appearance and behaviour of the axis. QCPColorScale duplicates some properties in its interface for convenience. Those are setDataRange (QCPAxis::setRange), setDataScaleType (QCPAxis::setScaleType), and the method setLabel (QCPAxis::setLabel). As they each are connected, it does not matter whether you use the method on the QCPColorScale or on its QCPAxis.
If the type of the color scale is changed with setType, the axis returned by this method will change, too, to either the left, right, bottom or top axis, depending on which type was set.
Definition at line 5896 of file qcustomplot.h.
|
inline |
Definition at line 2892 of file qcustomplot.h.
|
inline |
Definition at line 5902 of file qcustomplot.h.
|
inline |
Definition at line 2898 of file qcustomplot.h.
| QList< QCPColorMap * > QCPColorScale::colorMaps | ( | ) | const |
Returns a list of all the color maps associated with this color scale.
Definition at line 20310 of file qcustomplot.cpp.
References QCPLayerable::mParentPlot, QCustomPlot::plottable(), QCustomPlot::plottableCount(), and result.
Referenced by rescaleDataRange().
| QList<QCPColorMap *> QCPColorScale::colorMaps | ( | ) | const |
|
inline |
Definition at line 5898 of file qcustomplot.h.
Referenced by setDataRange().
|
inline |
Definition at line 2894 of file qcustomplot.h.
|
signal |
This signal is emitted when the data range changes.
Referenced by setDataRange().
|
signal |
This signal is emitted when the data range changes.
|
inline |
Definition at line 5899 of file qcustomplot.h.
|
inline |
Definition at line 2895 of file qcustomplot.h.
|
signal |
This signal is emitted when the data scale type changes.
Referenced by setDataScaleType().
|
signal |
|
inline |
Definition at line 5900 of file qcustomplot.h.
Referenced by setGradient().
|
inline |
Definition at line 2896 of file qcustomplot.h.
|
signal |
|
signal |
This signal is emitted when the gradient changes.
| QString QCPColorScale::label | ( | ) | const |
Definition at line 20077 of file qcustomplot.cpp.
References mColorAxis.
| QString QCPColorScale::label | ( | ) | const |
|
protectedvirtual |
This event is called, if the mouse is moved inside the outer rect of this layout element.
Reimplemented from QCPLayoutElement.
Definition at line 14558 of file qcustomplot.cpp.
|
protectedvirtual |
This event gets called when the user moves the mouse while holding a mouse button, after this layerable has become the mouse grabber by accepting the preceding mousePressEvent.
The current pixel position of the cursor on the QCustomPlot widget is accessible via event->pos(). The parameter startPos indicates the position where the initial mousePressEvent occured, that started the mouse interaction.
The default implementation does nothing.
Reimplemented from QCPLayerable.
Definition at line 20438 of file qcustomplot.cpp.
|
protectedvirtual |
This event is called, if the mouse was pressed while being inside the outer rect of this layout element.
Reimplemented from QCPLayoutElement.
Definition at line 14549 of file qcustomplot.cpp.
|
protectedvirtual |
This event gets called when the user presses a mouse button while the cursor is over the layerable. Whether a cursor is over the layerable is decided by a preceding call to selectTest.
The current pixel position of the cursor on the QCustomPlot widget is accessible via event->pos(). The parameter details contains layerable-specific details about the hit, which were generated in the previous call to selectTest. For example, One-dimensional plottables like QCPGraph or QCPBars convey the clicked data point in the details parameter, as QCPDataSelection packed as QVariant. Multi-part objects convey the specific SelectablePart that was hit (e.g. QCPAxis::SelectablePart in the case of axes).
QCustomPlot uses an event propagation system that works the same as Qt's system. If your layerable doesn't reimplement the mousePressEvent or explicitly calls event->ignore() in its reimplementation, the event will be propagated to the next layerable in the stacking order.
Once a layerable has accepted the mousePressEvent, it is considered the mouse grabber and will receive all following calls to mouseMoveEvent or mouseReleaseEvent for this mouse interaction (a "mouse interaction" in this context ends with the release).
The default implementation does nothing except explicitly ignoring the event with event->ignore().
Reimplemented from QCPLayerable.
Definition at line 20428 of file qcustomplot.cpp.
|
protectedvirtual |
This event is called, if the mouse was previously pressed inside the outer rect of this layout element and is now released.
Reimplemented from QCPLayoutElement.
Definition at line 14567 of file qcustomplot.cpp.
|
protectedvirtual |
This event gets called when the user releases the mouse button, after this layerable has become the mouse grabber by accepting the preceding mousePressEvent.
The current pixel position of the cursor on the QCustomPlot widget is accessible via event->pos(). The parameter startPos indicates the position where the initial mousePressEvent occured, that started the mouse interaction.
The default implementation does nothing.
Reimplemented from QCPLayerable.
Definition at line 20448 of file qcustomplot.cpp.
| bool QCPColorScale::rangeDrag | ( | ) | const |
Definition at line 20087 of file qcustomplot.cpp.
References mAxisRect, mType, and QCPAxis::orientation().
| bool QCPColorScale::rangeDrag | ( | ) | const |
| bool QCPColorScale::rangeZoom | ( | ) | const |
Definition at line 20101 of file qcustomplot.cpp.
References mAxisRect, mType, and QCPAxis::orientation().
| bool QCPColorScale::rangeZoom | ( | ) | const |
| void QCPColorScale::rescaleDataRange | ( | bool | onlyVisibleMaps | ) |
Changes the data range such that all color maps associated with this color scale are fully mapped to the gradient in the data dimension.
Definition at line 20326 of file qcustomplot.cpp.
References colorMaps(), e, QCPRange::expand(), QCPRange::lower, mDataRange, mDataScaleType, QCP::sdBoth, QCP::sdNegative, QCP::sdPositive, setDataRange(), QCPRange::size(), QCPAxis::stLinear, QCPAxis::stLogarithmic, QCPRange::upper, and QCPRange::validRange().
| void QCPColorScale::rescaleDataRange | ( | bool | onlyVisibleMaps | ) |
| void QCPColorScale::setBarWidth | ( | int | width | ) |
Sets the width (or height, for horizontal color scales) the bar where the gradient is displayed will have.
Definition at line 20258 of file qcustomplot.cpp.
| void QCPColorScale::setBarWidth | ( | int | width | ) |
| void QCPColorScale::setDataRange | ( | const QCPRange & | dataRange | ) |
Sets the range spanned by the color gradient and that is shown by the axis in the color scale.
It is equivalent to calling QCPColorMap::setDataRange on any of the connected color maps. It is also equivalent to directly accessing the axis and setting its range with QCPAxis::setRange.
Definition at line 20185 of file qcustomplot.cpp.
References dataRange(), dataRangeChanged(), QCPRange::lower, mColorAxis, mDataRange, and QCPRange::upper.
Referenced by QCPColorScale(), rescaleDataRange(), setDataScaleType(), and setType().
| Q_SLOT void QCPColorScale::setDataRange | ( | const QCPRange & | dataRange | ) |
| void QCPColorScale::setDataScaleType | ( | QCPAxis::ScaleType | scaleType | ) |
Sets the scale type of the color scale, i.e. whether values are associated with colors linearly or logarithmically.
It is equivalent to calling QCPColorMap::setDataScaleType on any of the connected color maps. It is also equivalent to directly accessing the axis and setting its scale type with QCPAxis::setScaleType.
Note that this method controls the coordinate transformation. For logarithmic scales, you will likely also want to use a logarithmic tick spacing and labeling, which can be achieved by setting the color scale's axis ticker to an instance of QCPAxisTickerLog :
qcpaxisticker-log-colorscale
See the documentation of QCPAxisTickerLog about the details of logarithmic axis tick creation.
Sets the scale type of the color scale, i.e. whether values are linearly associated with colors or logarithmically.
It is equivalent to calling QCPColorMap::setDataScaleType on any of the connected color maps. It is also equivalent to directly accessing the axis and setting its scale type with QCPAxis::setScaleType.
Definition at line 20215 of file qcustomplot.cpp.
References dataScaleTypeChanged(), mColorAxis, mDataRange, mDataScaleType, QCPRange::sanitizedForLogScale(), setDataRange(), and QCPAxis::stLogarithmic.
Referenced by setType().
| Q_SLOT void QCPColorScale::setDataScaleType | ( | QCPAxis::ScaleType | scaleType | ) |
| void QCPColorScale::setGradient | ( | const QCPColorGradient & | gradient | ) |
Sets the color gradient that will be used to represent data values.
It is equivalent to calling QCPColorMap::setGradient on any of the connected color maps.
Definition at line 20233 of file qcustomplot.cpp.
References gradient(), gradientChanged(), mAxisRect, and mGradient.
| Q_SLOT void QCPColorScale::setGradient | ( | const QCPColorGradient & | gradient | ) |
| void QCPColorScale::setLabel | ( | const QString & | str | ) |
Sets the axis label of the color scale. This is equivalent to calling QCPAxis::setLabel on the internal axis.
Definition at line 20245 of file qcustomplot.cpp.
References mColorAxis.
| void QCPColorScale::setLabel | ( | const QString & | str | ) |
| void QCPColorScale::setRangeDrag | ( | bool | enabled | ) |
Sets whether the user can drag the data range (setDataRange).
Note that QCP::iRangeDrag must be in the QCustomPlot's interactions (QCustomPlot::setInteractions) to allow range dragging.
Definition at line 20266 of file qcustomplot.cpp.
References mAxisRect, mType, and QCPAxis::orientation().
| void QCPColorScale::setRangeDrag | ( | bool | enabled | ) |
| void QCPColorScale::setRangeZoom | ( | bool | enabled | ) |
Sets whether the user can zoom the data range (setDataRange) by scrolling the mouse wheel.
Note that QCP::iRangeZoom must be in the QCustomPlot's interactions (QCustomPlot::setInteractions) to allow range dragging.
Definition at line 20290 of file qcustomplot.cpp.
References mAxisRect, mType, and QCPAxis::orientation().
| void QCPColorScale::setRangeZoom | ( | bool | enabled | ) |
| void QCPColorScale::setType | ( | QCPAxis::AxisType | type | ) |
Sets at which side of the color scale the axis is placed, and thus also its orientation.
Note that after setting type to a different value, the axis returned by axis() will be a different one. The new axis will adopt the following properties from the previous axis: The range, scale type, label and ticker (the latter will be shared and not copied).
Sets at which side of the color scale the axis is placed, and thus also its orientation.
Note that after setting type to a different value, the axis returned by axis() will be a different one. The new axis will adopt the following properties from the previous axis: The range, scale type, log base and label.
Definition at line 20123 of file qcustomplot.cpp.
References QCPAxis::atBottom, QCPAxis::atLeft, QCPAxis::atRight, QCPAxis::atTop, mAxisRect, mColorAxis, mType, setDataRange(), setDataScaleType(), and type().
Referenced by QCPColorScale().
| void QCPColorScale::setType | ( | QCPAxis::AxisType | type | ) |
|
inline |
Definition at line 5897 of file qcustomplot.h.
Referenced by setType().
|
inline |
Definition at line 2893 of file qcustomplot.h.
|
virtual |
Updates the layout element and sub-elements. This function is automatically called before every replot by the parent layout element. It is called multiple times, once for every UpdatePhase. The phases are run through in the order of the enum values. For details about what happens at the different phases, see the documentation of UpdatePhase.
Layout elements that have child elements should call the update method of their child elements, and pass the current phase unchanged.
The default implementation executes the automatic margin mechanism in the upMargins phase. Subclasses should make sure to call the base class implementation.
Reimplemented from QCPLayoutElement.
Definition at line 20385 of file qcustomplot.cpp.
References QCPAxis::atBottom, QCPAxis::atTop, mAxisRect, mBarWidth, mType, QCPLayoutElement::rect(), QCPLayoutElement::setMaximumSize(), QCPLayoutElement::setMinimumSize(), QCPLayoutElement::update(), QCPLayoutElement::upLayout, and QCPLayoutElement::upMargins.
|
virtual |
Updates the layout element and sub-elements. This function is automatically called before every replot by the parent layout element. It is called multiple times, once for every UpdatePhase. The phases are run through in the order of the enum values. For details about what happens at the different phases, see the documentation of UpdatePhase.
Layout elements that have child elements should call the update method of their child elements, and pass the current phase unchanged.
The default implementation executes the automatic margin mechanism in the upMargins phase. Subclasses should make sure to call the base class implementation.
Reimplemented from QCPLayoutElement.
|
protectedvirtual |
This event is called, if the mouse wheel is scrolled while the cursor is inside the rect of this layout element.
Reimplemented from QCPLayoutElement.
Definition at line 20458 of file qcustomplot.cpp.
|
protectedvirtual |
This event is called, if the mouse wheel is scrolled while the cursor is inside the rect of this layout element.
Reimplemented from QCPLayoutElement.
|
protected |
Definition at line 5937 of file qcustomplot.h.
Referenced by mouseMoveEvent(), mousePressEvent(), mouseReleaseEvent(), rangeDrag(), rangeZoom(), setGradient(), setRangeDrag(), setRangeZoom(), setType(), update(), wheelEvent(), and ~QCPColorScale().
|
protected |
Definition at line 5934 of file qcustomplot.h.
Referenced by setBarWidth(), and update().
|
protected |
Definition at line 5938 of file qcustomplot.h.
Referenced by label(), setDataRange(), setDataScaleType(), setLabel(), and setType().
|
protected |
Definition at line 5931 of file qcustomplot.h.
Referenced by rescaleDataRange(), setDataRange(), and setDataScaleType().
|
protected |
Definition at line 5932 of file qcustomplot.h.
Referenced by rescaleDataRange(), and setDataScaleType().
|
protected |
Definition at line 5933 of file qcustomplot.h.
Referenced by setGradient().
|
protected |
Definition at line 5930 of file qcustomplot.h.
Referenced by rangeDrag(), rangeZoom(), setRangeDrag(), setRangeZoom(), setType(), and update().